Fig. 5
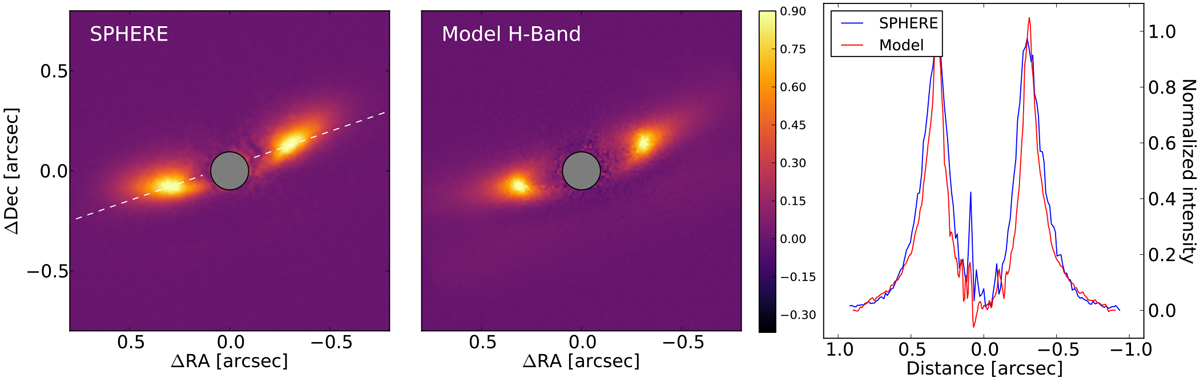
Left panel: observed polarized intensity of J1608. Middle panel: PI model map. Both maps are normalized to their maximum. Right panel: radial cuts along the major axis for the PI images of the data and model, smoothed with a Gaussian kernel with a standard deviation of 9 mas. The position of the cut is indicated by the dotted line in the left panel.
Current usage metrics show cumulative count of Article Views (full-text article views including HTML views, PDF and ePub downloads, according to the available data) and Abstracts Views on Vision4Press platform.
Data correspond to usage on the plateform after 2015. The current usage metrics is available 48-96 hours after online publication and is updated daily on week days.
Initial download of the metrics may take a while.