Fig. 4
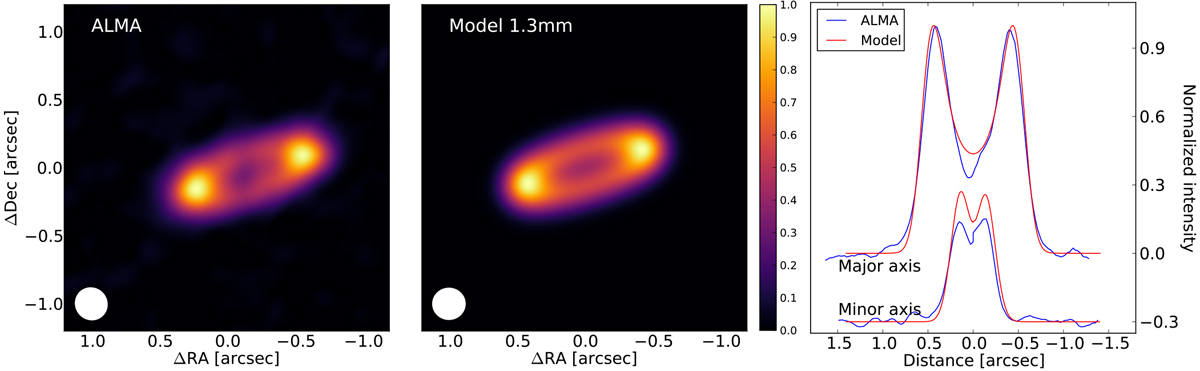
Left panel: normalized ALMA Band 6 image of J1608, with a peak flux of 7.1 mJy. The beam is shown in the bottom left of the image. Middle panel: normalized model obtained after convolution by a beam of 0.24′′ × 0.23′′. Right panel: radial cuts along the major and minor axis, with each map normalized to its maximum. For clarity, the cut along the minor axis is shifted by −0.3 in normalized intensity. The peaks are located at 0.4′′ (62 au) along the major axis and 0.14′′ (22 au) along the minor axis.
Current usage metrics show cumulative count of Article Views (full-text article views including HTML views, PDF and ePub downloads, according to the available data) and Abstracts Views on Vision4Press platform.
Data correspond to usage on the plateform after 2015. The current usage metrics is available 48-96 hours after online publication and is updated daily on week days.
Initial download of the metrics may take a while.