Open Access
Fig. 2
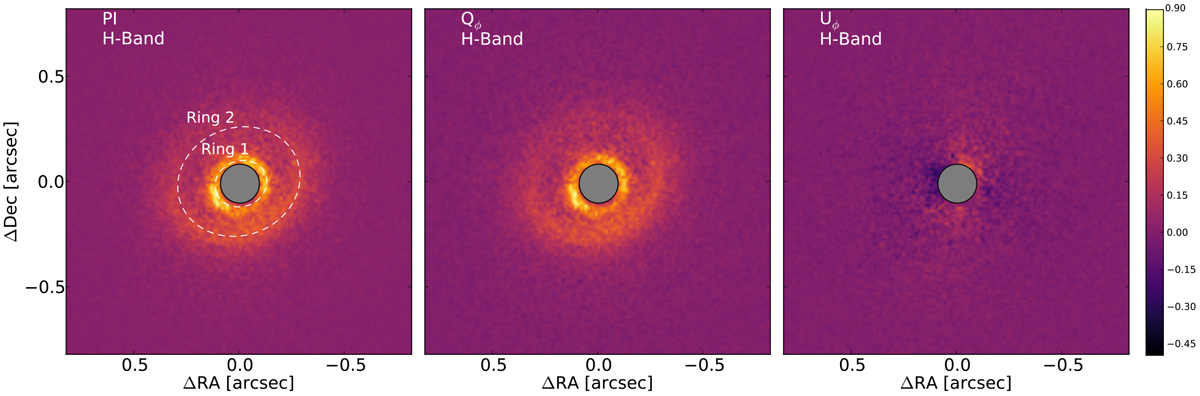
Normalized polarized intensity map (left panel), Qϕ (middle panel), and Uϕ (right panel)maps of J1852, observed in H-Band with a coronagraph. The Qϕ and Uϕ maps are normalized to the maximum of Qϕ. The dashed ellipses in the left panel represent the two scattered light rings (see text for details).
Current usage metrics show cumulative count of Article Views (full-text article views including HTML views, PDF and ePub downloads, according to the available data) and Abstracts Views on Vision4Press platform.
Data correspond to usage on the plateform after 2015. The current usage metrics is available 48-96 hours after online publication and is updated daily on week days.
Initial download of the metrics may take a while.