Open Access
Fig. A.3
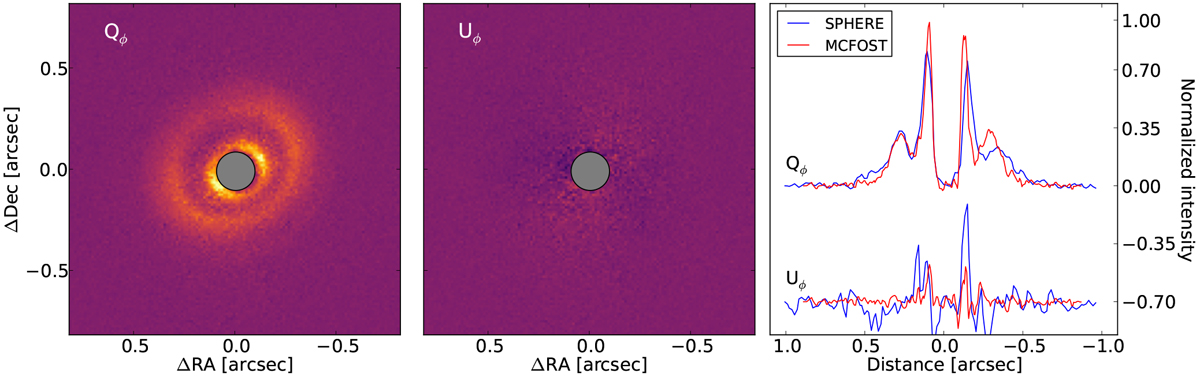
Leftand middle panels: Qϕ and Uϕ images of our model of J1852, respectively. The colorscale used in the same as in Fig. 9. Right panel: radial cuts along the major axis, compared to the data.
Current usage metrics show cumulative count of Article Views (full-text article views including HTML views, PDF and ePub downloads, according to the available data) and Abstracts Views on Vision4Press platform.
Data correspond to usage on the plateform after 2015. The current usage metrics is available 48-96 hours after online publication and is updated daily on week days.
Initial download of the metrics may take a while.