Fig. 1
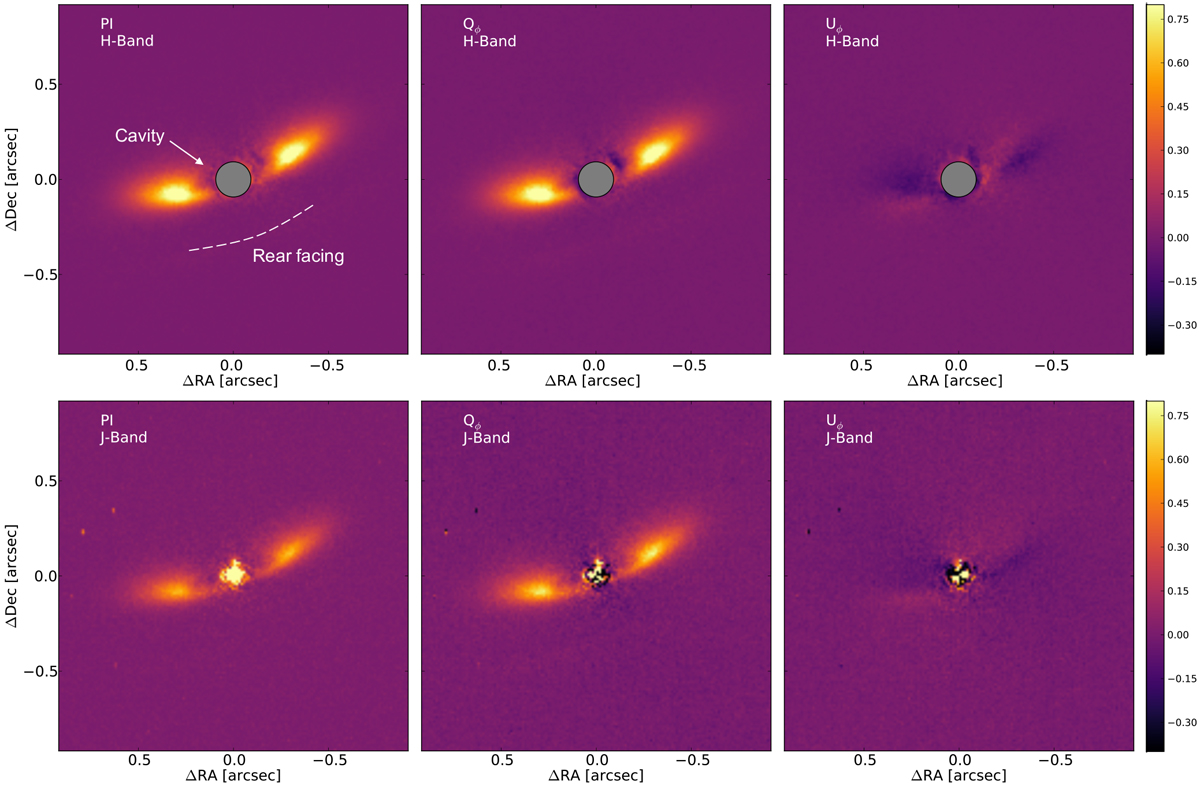
Normalized polarized intensity map (left panel), Qϕ (middle panel), and Uϕ (right panel)maps of J1608. Top panel: H-Band observations, obtained with a coronagraph as illustrated by the grey circle of diameter 0.185′′. The dashed line in the left panel traces the faint scattered light from the rear-facing near side of the disk (see Fig. A.1). Bottom panel: J-band observations, obtained without coronagraph. Each Qϕ and Uϕ maps are normalized to the maximum of Qϕ.
Current usage metrics show cumulative count of Article Views (full-text article views including HTML views, PDF and ePub downloads, according to the available data) and Abstracts Views on Vision4Press platform.
Data correspond to usage on the plateform after 2015. The current usage metrics is available 48-96 hours after online publication and is updated daily on week days.
Initial download of the metrics may take a while.