Fig. 4.
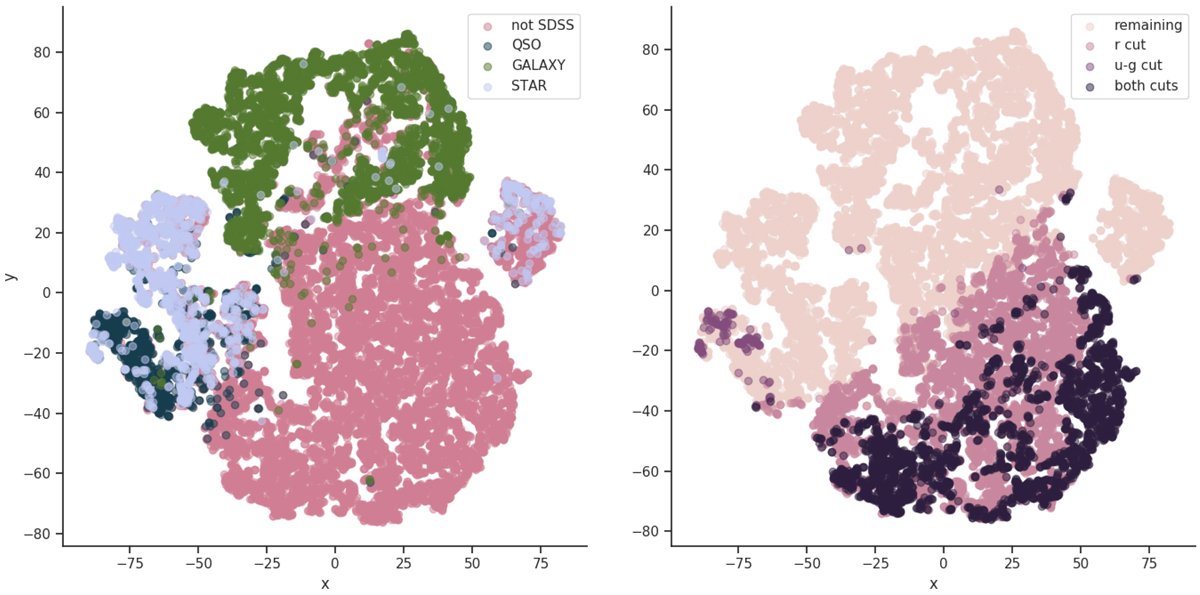
t-SNE visualization of the catalog feature space. Left panel: datapoints with SDSS labels from the training set (green and light and dark blue) together with those from the inference sample without training coverage (pink). Right panel: results of applying magnitude and color cuts on the inference sample. The darkest color shows objects removed by both r < 22 and u − g > 0 criteria simultaneously, colors in between stand for objects removed by only one of those cuts, and the lightest points are left after the cuts.
Current usage metrics show cumulative count of Article Views (full-text article views including HTML views, PDF and ePub downloads, according to the available data) and Abstracts Views on Vision4Press platform.
Data correspond to usage on the plateform after 2015. The current usage metrics is available 48-96 hours after online publication and is updated daily on week days.
Initial download of the metrics may take a while.