Fig. 11.
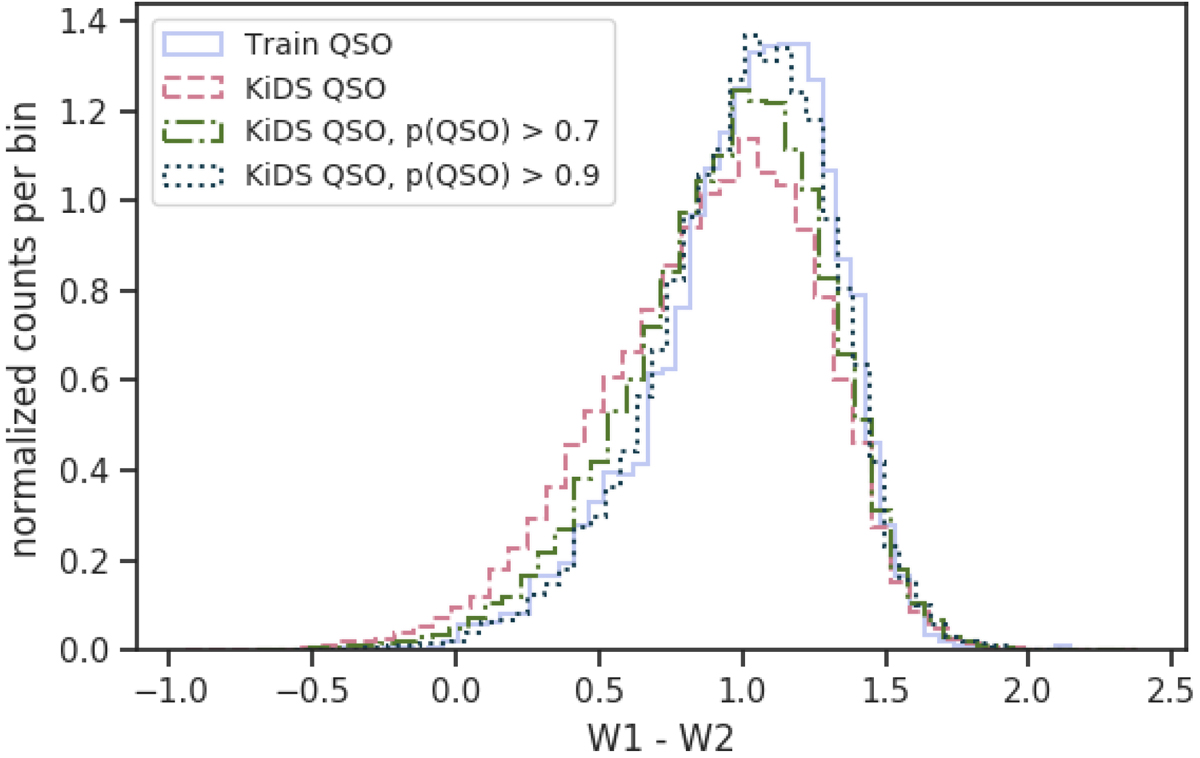
Distribution of the mid-infrared W1 − W2 color (3.4 μm–4.6 μm, Vega) of quasar candidates in our KiDS sample, derived from a cross-match with all-sky WISE data. We show histograms for all KiDS QSOs matched with WISE, as well as for two examples of the probability cut: pQSO > 0.7, which is recommended to increase the purity of the sample, and pQSO > 0.9 to illustrate how the resulting W1 − W2 changes when the minimum probability considerably increases.
Current usage metrics show cumulative count of Article Views (full-text article views including HTML views, PDF and ePub downloads, according to the available data) and Abstracts Views on Vision4Press platform.
Data correspond to usage on the plateform after 2015. The current usage metrics is available 48-96 hours after online publication and is updated daily on week days.
Initial download of the metrics may take a while.