Fig. 7
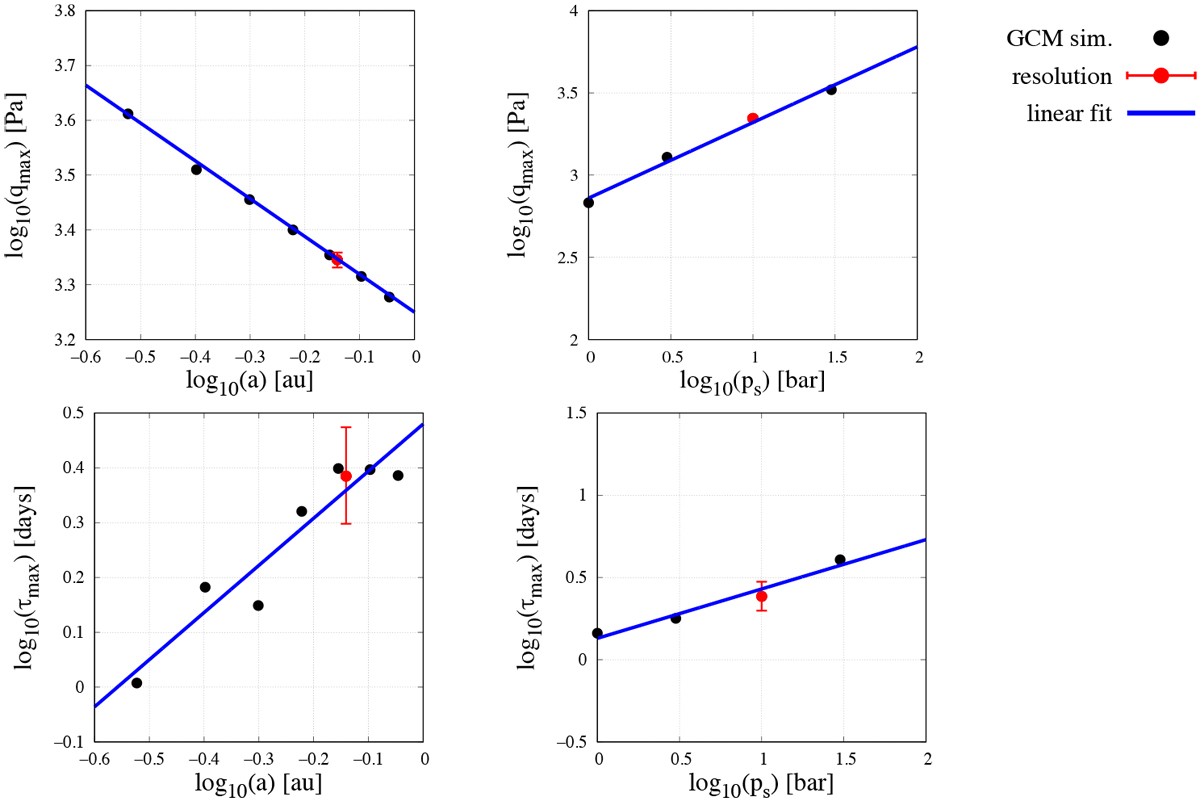
Parameters of the Maxwell model given by Eq. (19) computed from GCM simulations as functions of the star-planet distance a (left panels, in au) and ps (right panels, in bar) in logarithmic scales. Top panels: amplitude qmax of the maximum (Pa). Bottom panels: associated characteristic thermal time τmax (days). Numerical results obtained with GCM simulations are designated by black points, the corresponding linear regressions (see Table 2) by solid blue lines. For the reference case, error bars are given to indicate the resolution ofthe sampling (for details about how they are constructed, see Sect. 5.2).
Current usage metrics show cumulative count of Article Views (full-text article views including HTML views, PDF and ePub downloads, according to the available data) and Abstracts Views on Vision4Press platform.
Data correspond to usage on the plateform after 2015. The current usage metrics is available 48-96 hours after online publication and is updated daily on week days.
Initial download of the metrics may take a while.