Fig. 6
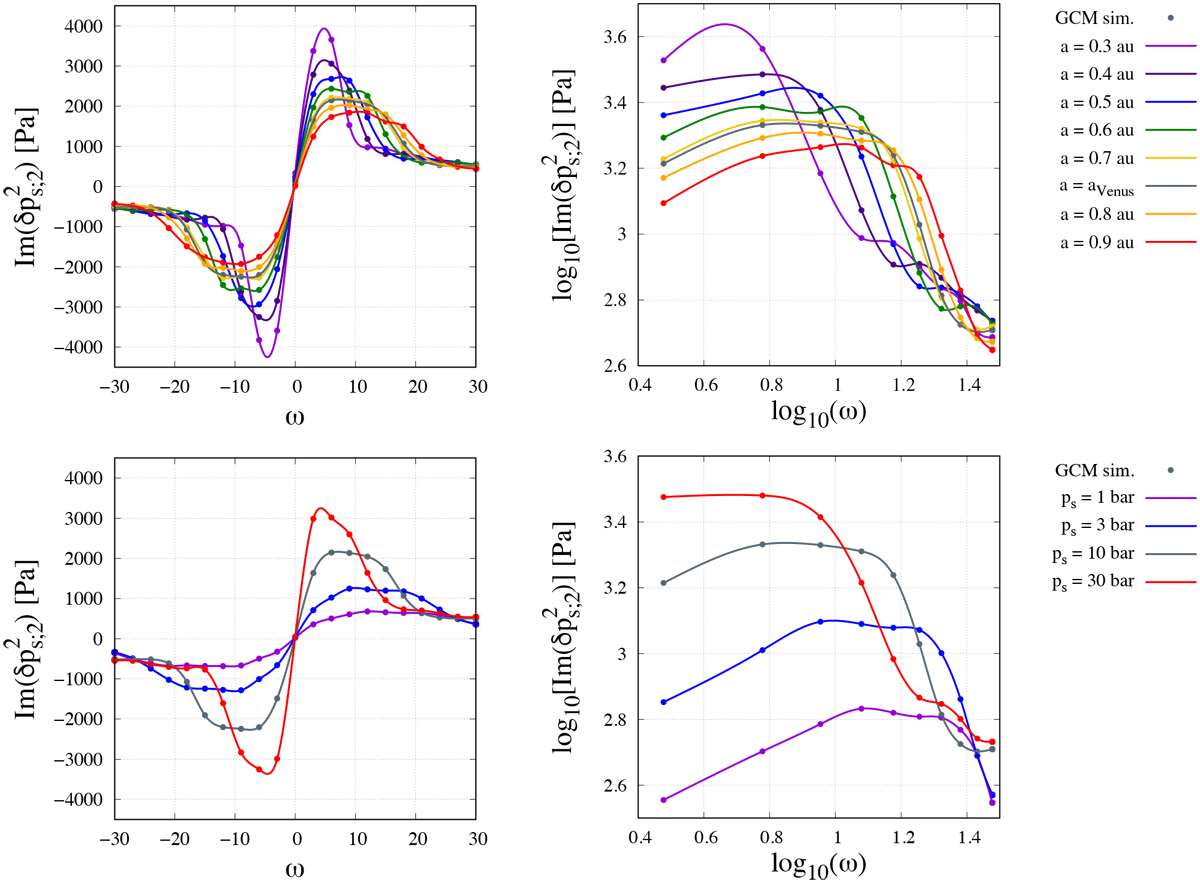
Imaginary part of the ![]() harmonic of surface pressure oscillations (Pa) as a function of the normalized tidal frequency
harmonic of surface pressure oscillations (Pa) as a function of the normalized tidal frequency
![]() in linear (leftpanels) and logarithmic scales (for ω > 0).
Top panels: spectra obtained with GCM numerical simulations for a fixed surface pressure,
ps = 10 bar, and various values of the star–planet distance: a = 0.3–0.9 au with a step Δa = 0.1 au.
Bottom panels: spectra obtained for a fixed star planet–planet distance, a = aVenus
and various values of the surface pressure : ps = 1, 3, 10, 30 bar. Numerical results are designated by points and interpolated with cubic splines. The reference case of the study (a = aVenus
and ps = 10 bar) corresponds to the grey line in all plots.
in linear (leftpanels) and logarithmic scales (for ω > 0).
Top panels: spectra obtained with GCM numerical simulations for a fixed surface pressure,
ps = 10 bar, and various values of the star–planet distance: a = 0.3–0.9 au with a step Δa = 0.1 au.
Bottom panels: spectra obtained for a fixed star planet–planet distance, a = aVenus
and various values of the surface pressure : ps = 1, 3, 10, 30 bar. Numerical results are designated by points and interpolated with cubic splines. The reference case of the study (a = aVenus
and ps = 10 bar) corresponds to the grey line in all plots.
Current usage metrics show cumulative count of Article Views (full-text article views including HTML views, PDF and ePub downloads, according to the available data) and Abstracts Views on Vision4Press platform.
Data correspond to usage on the plateform after 2015. The current usage metrics is available 48-96 hours after online publication and is updated daily on week days.
Initial download of the metrics may take a while.