Fig. 5
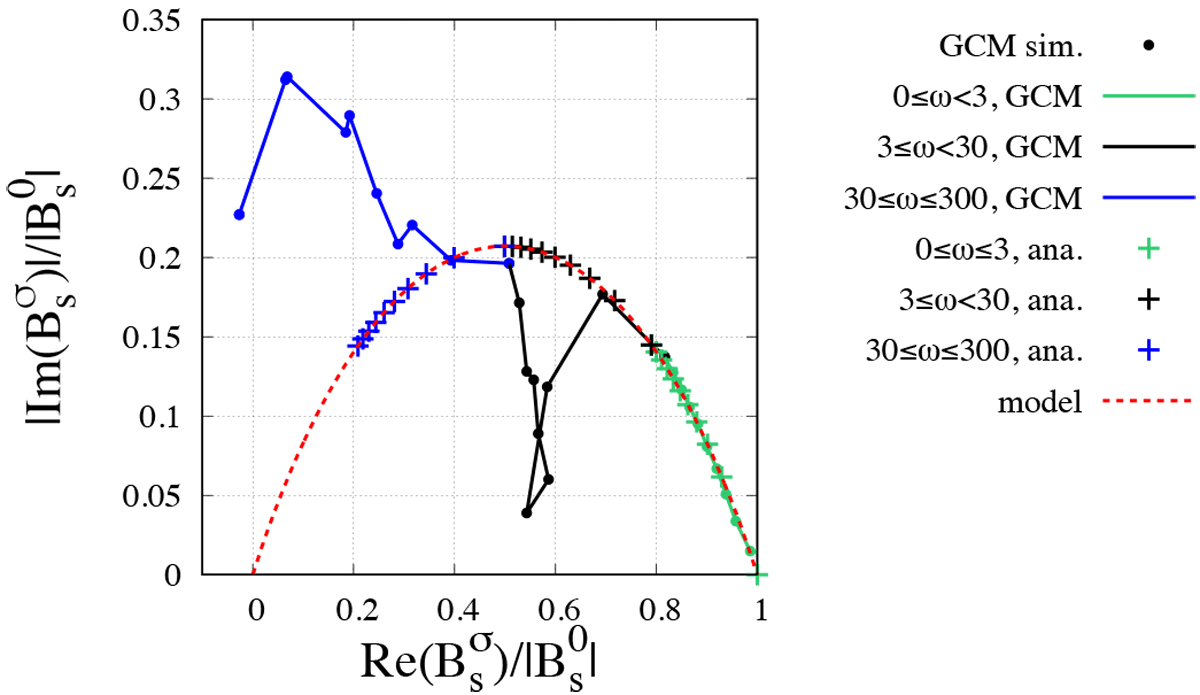
Nyquist plot of the transfer function ![]() associated with the
associated with the ![]() component of the semidiurnal tide, that is such that
component of the semidiurnal tide, that is such that ![]() . The imaginary part of the normalized function
. The imaginary part of the normalized function ![]() is plotted in absolute value as a function of the real part in the reference case of the study (a = aVenus
and ps = 10 bar). Values obtained using GCM simulations are indicated by points. They are interpolated by a green line in the range
0 ≤ ω < 3 (step Δω = 0.3), a black line in the range 3 ≤ ω < 30 (step Δω = 3), and a blue line in the range 30 ≤ ω ≤ 300 (step Δω = 30),
is plotted in absolute value as a function of the real part in the reference case of the study (a = aVenus
and ps = 10 bar). Values obtained using GCM simulations are indicated by points. They are interpolated by a green line in the range
0 ≤ ω < 3 (step Δω = 0.3), a black line in the range 3 ≤ ω < 30 (step Δω = 3), and a blue line in the range 30 ≤ ω ≤ 300 (step Δω = 30),
![]() being the normalized tidal frequency. Similarly, values obtained in these ranges with the model given by Eq. (32) for the surface thermal time
τs = 0.3 days are designated by crosses. The red line corresponds to the function itself.
being the normalized tidal frequency. Similarly, values obtained in these ranges with the model given by Eq. (32) for the surface thermal time
τs = 0.3 days are designated by crosses. The red line corresponds to the function itself.
Current usage metrics show cumulative count of Article Views (full-text article views including HTML views, PDF and ePub downloads, according to the available data) and Abstracts Views on Vision4Press platform.
Data correspond to usage on the plateform after 2015. The current usage metrics is available 48-96 hours after online publication and is updated daily on week days.
Initial download of the metrics may take a while.