Fig. 3
Imaginary part of the ![]() component of surface pressure variations as a function of the normalized forcing frequency
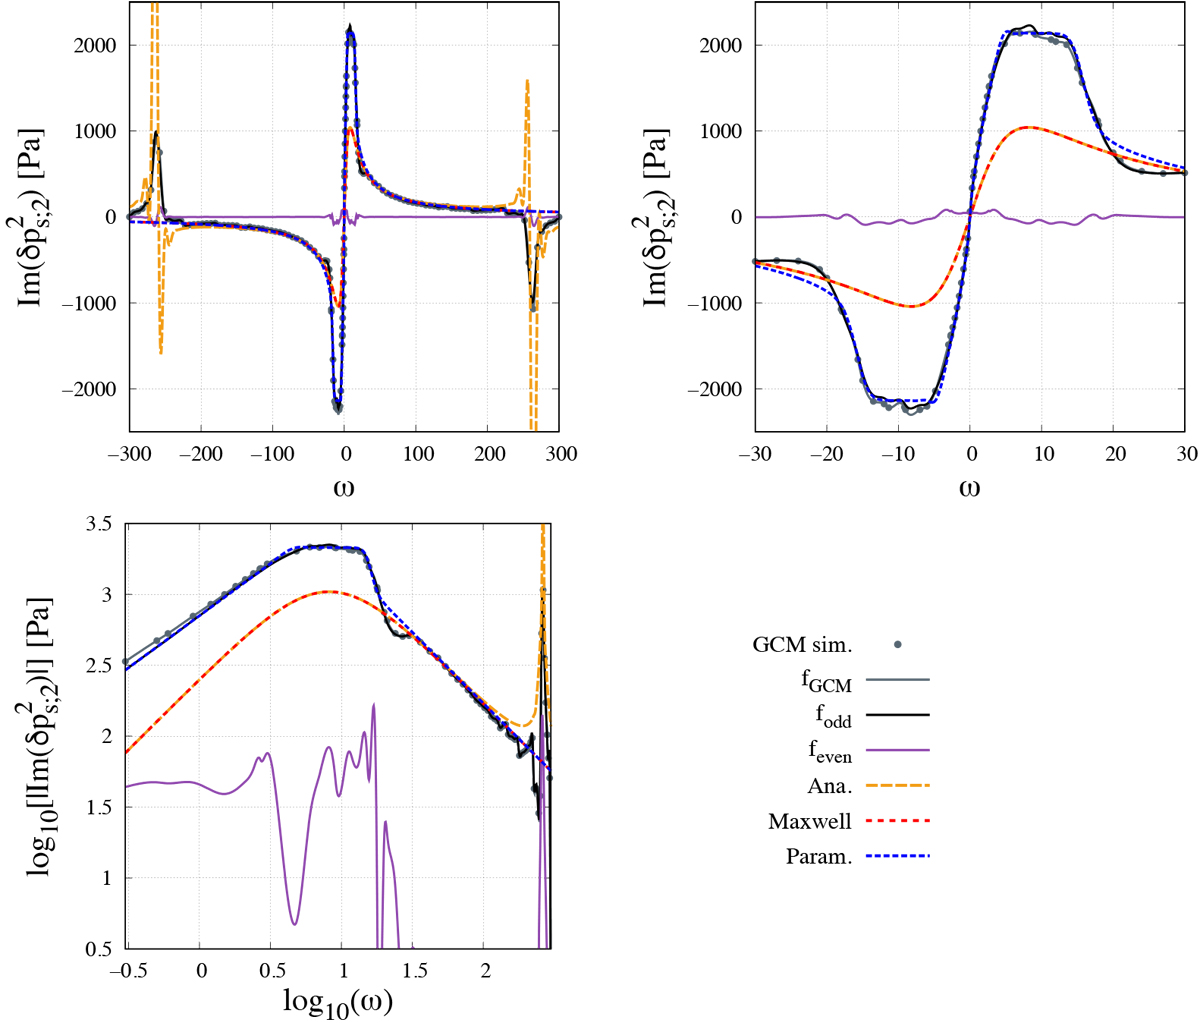
component of surface pressure variations as a function of the normalized forcing frequency
![]() in the reference case (a = aVenus
and ps = 10 bar).
Top left panel: spectrum over the high-frequency range (− 300 < ω < 300) in linear scales. Top right panel: spectrum over the low-frequency range (− 30 < ω < 30) in linear scales. Bottom left panel: spectrum in logarithmic scales (for ω > 0). Numerical results obtained with GCM simulations are plotted (grey points), as well as the interpolating function
fGCM (grey solid line), the odd and even functions of σ
defined by Eqs. (6) and (8) (black and purple solid line, respectively), the function derived from the abinitio analytical model and given by Eqs. (12) and (13) (orange dashed line), its Maxwell-like approximation given by Eq. (17) (red dotted line), and the parametrized function given by Eq. (26) (blue dashed line).
in the reference case (a = aVenus
and ps = 10 bar).
Top left panel: spectrum over the high-frequency range (− 300 < ω < 300) in linear scales. Top right panel: spectrum over the low-frequency range (− 30 < ω < 30) in linear scales. Bottom left panel: spectrum in logarithmic scales (for ω > 0). Numerical results obtained with GCM simulations are plotted (grey points), as well as the interpolating function
fGCM (grey solid line), the odd and even functions of σ
defined by Eqs. (6) and (8) (black and purple solid line, respectively), the function derived from the abinitio analytical model and given by Eqs. (12) and (13) (orange dashed line), its Maxwell-like approximation given by Eq. (17) (red dotted line), and the parametrized function given by Eq. (26) (blue dashed line).
Current usage metrics show cumulative count of Article Views (full-text article views including HTML views, PDF and ePub downloads, according to the available data) and Abstracts Views on Vision4Press platform.
Data correspond to usage on the plateform after 2015. The current usage metrics is available 48-96 hours after online publication and is updated daily on week days.
Initial download of the metrics may take a while.