Fig. 2
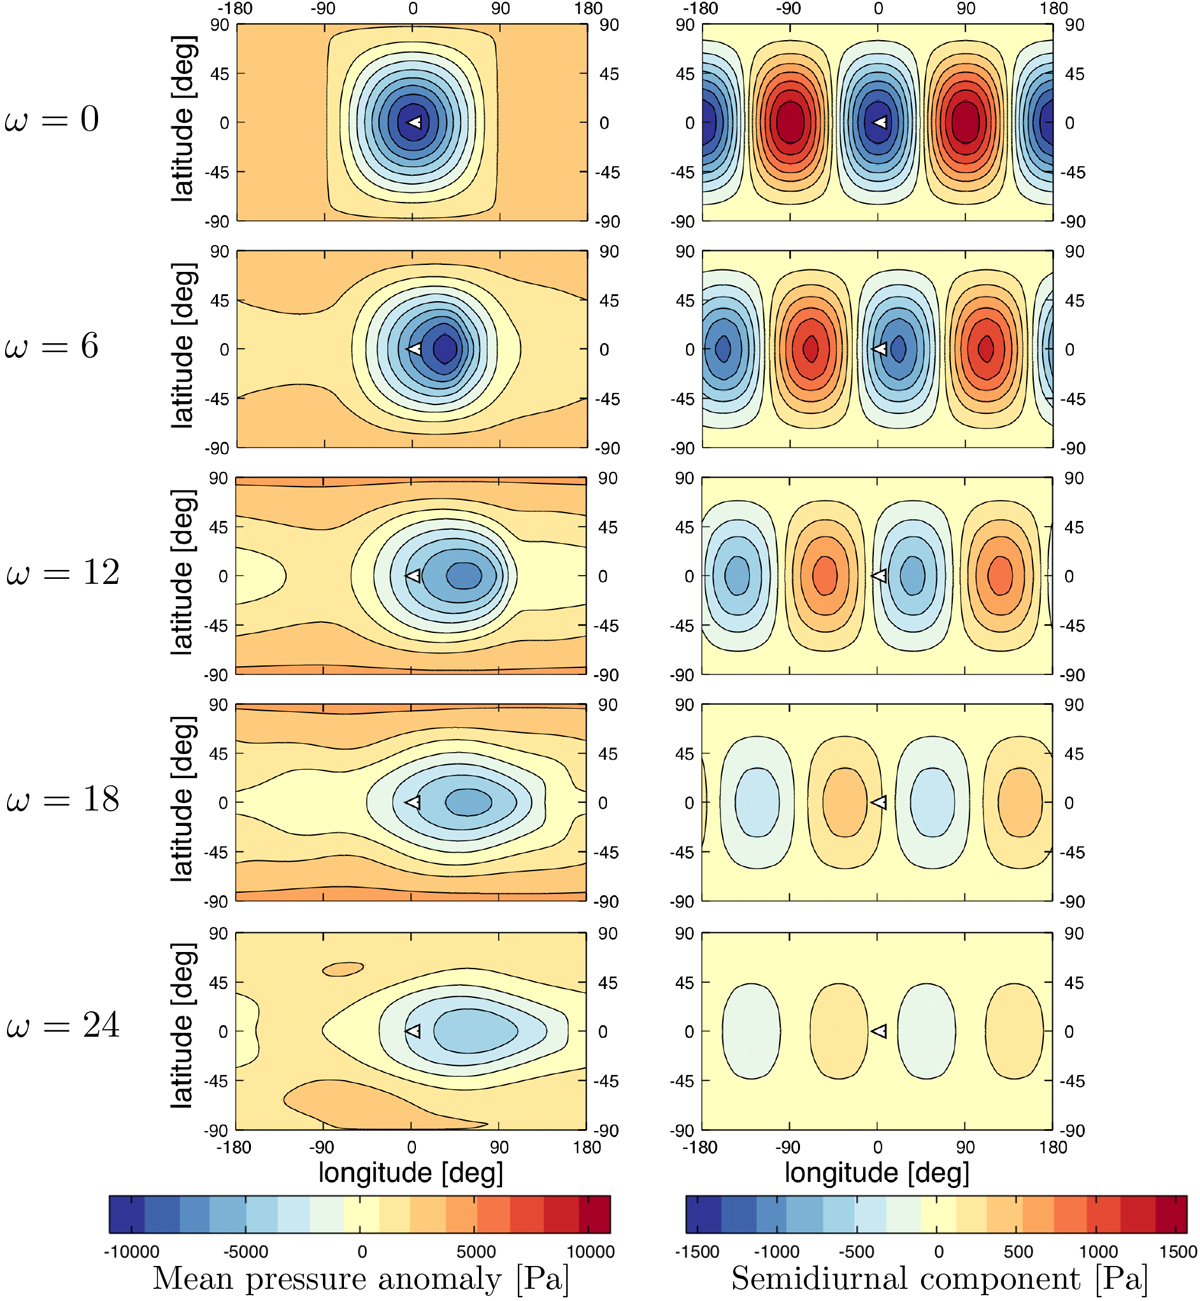
Surface pressure anomaly created by the thermal tide. Left panels: daily averaged spatial distribution of the departure of the surface pressure from its mean value created by the thermal tide. Right panels:
spatial distribution of the semidiurnal component only. The surface pressure anomaly is computed for 300 Solar days and folded over one Solar day centred on the substellar point, whose location and direction of motion are shown with a white arrow. From top to bottom panels: normalized forcing frequency
![]() is increased from 0 (spin-orbit synchronization) to 24 (this corresponds to the length of the Solar day
Psol = 9.36 days) for the reference case of the study (a = aVenus
and ps = 10 bar).
is increased from 0 (spin-orbit synchronization) to 24 (this corresponds to the length of the Solar day
Psol = 9.36 days) for the reference case of the study (a = aVenus
and ps = 10 bar).
Current usage metrics show cumulative count of Article Views (full-text article views including HTML views, PDF and ePub downloads, according to the available data) and Abstracts Views on Vision4Press platform.
Data correspond to usage on the plateform after 2015. The current usage metrics is available 48-96 hours after online publication and is updated daily on week days.
Initial download of the metrics may take a while.