Open Access
Fig. 2.
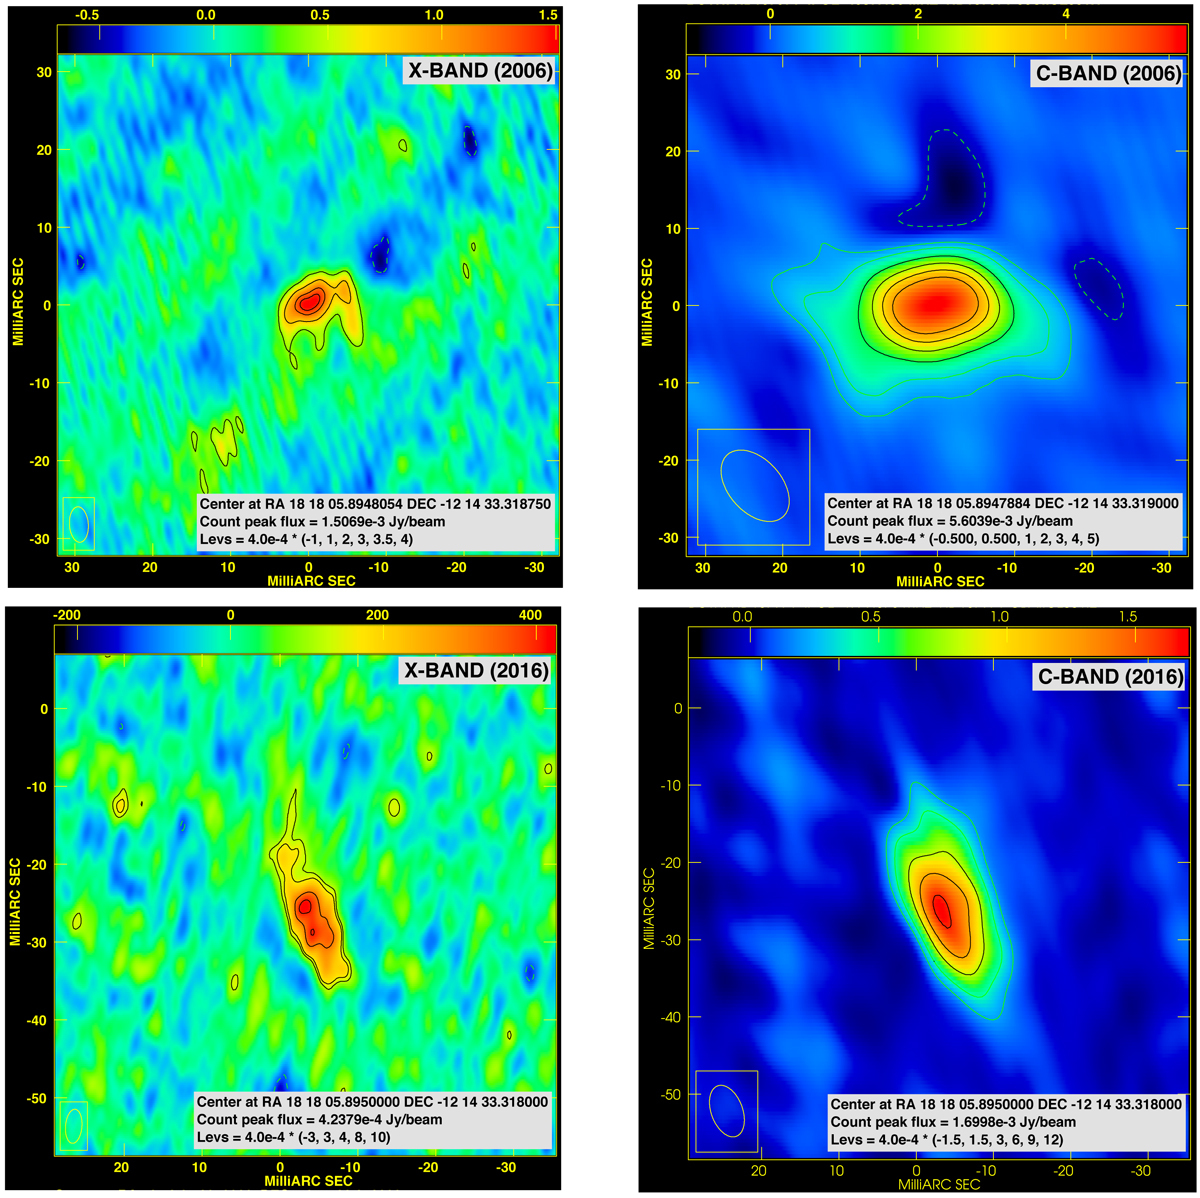
Maps of the nonthermal radio emission observed in HD 167971. The radio bands and epochs are shown in each of the image panels. The synthesized beam, coordinates of the field center, peak-flux, and contour levels are also displayed in each of the panels.
Current usage metrics show cumulative count of Article Views (full-text article views including HTML views, PDF and ePub downloads, according to the available data) and Abstracts Views on Vision4Press platform.
Data correspond to usage on the plateform after 2015. The current usage metrics is available 48-96 hours after online publication and is updated daily on week days.
Initial download of the metrics may take a while.