Free Access
Fig. 9
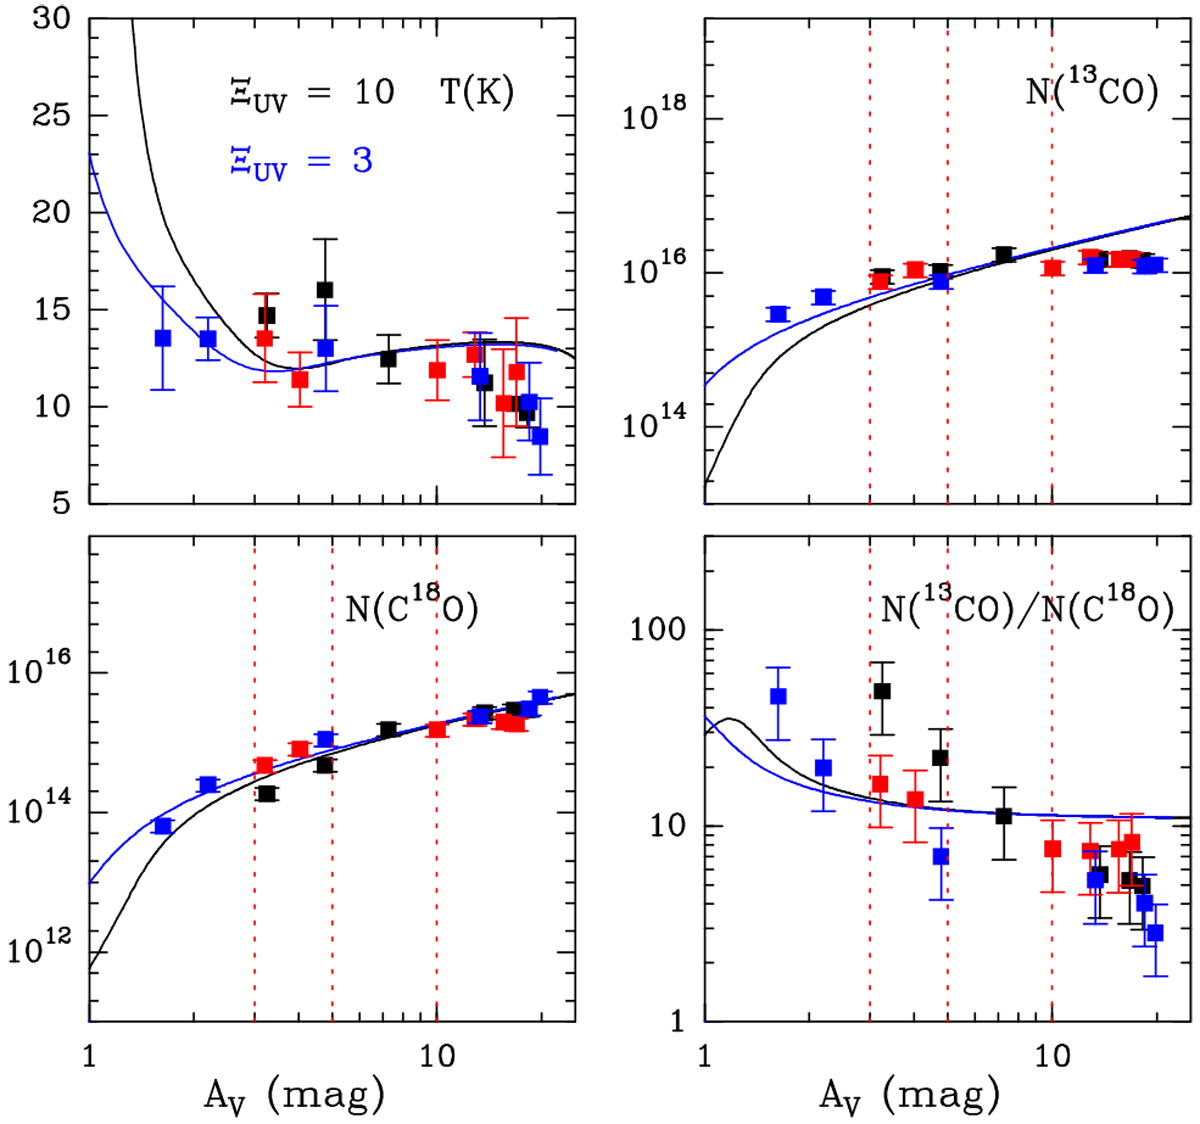
Comparison between our “Best-fit” model (see Table 5) and the molecular abundances derived in this work. The black line corresponds to the model with χUV =10 and the blue line to χUV = 3. Dashed red lines indicate AV = 3, 5 and 10 mag. The observational points are indicated with squares as in Fig. 8.
Current usage metrics show cumulative count of Article Views (full-text article views including HTML views, PDF and ePub downloads, according to the available data) and Abstracts Views on Vision4Press platform.
Data correspond to usage on the plateform after 2015. The current usage metrics is available 48-96 hours after online publication and is updated daily on week days.
Initial download of the metrics may take a while.