Fig. 8
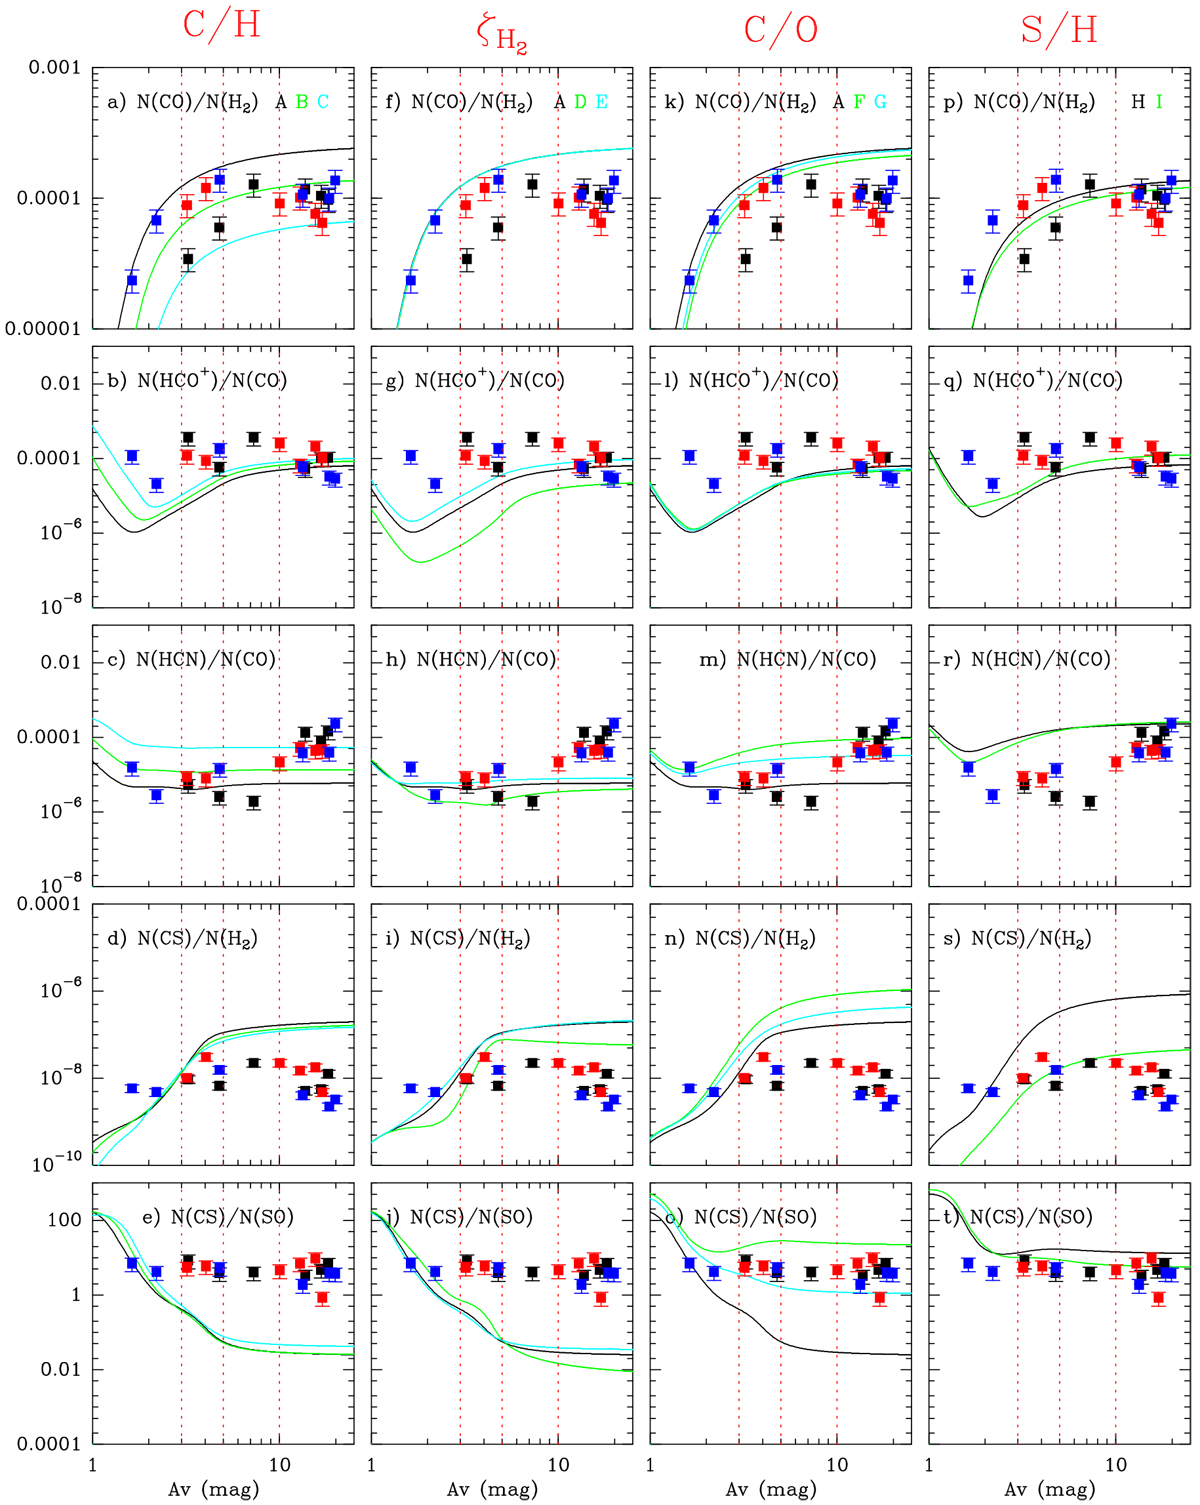
Comparison between the predictions of models listed in Table 5 and the cumulative column densities derived in TMC 1. In this figure, we have selected N(CO)/N(H2), N(HCO+)/N(CO), N(HCN)/N(CO), N(CS)/N(H2) and N(CS)/N(SO) to explore the parameter space, where N(CO) has been derived from our observations as N(CO) = 600 × N(C18O) and N(H2) = AV(mag) × 1021 cm−2. The observational points are indicated with squares and different colors correspond to the three observed cuts as follows: black for TMC 1-CP, red for TMC 1-NH3 and blue for TMC 1-C. Dashed red lines indicate AV = 3 mag (C+/C/CO transition region), AV = 5 (translucent cloud) and AV = 10 mag (dense region).
Current usage metrics show cumulative count of Article Views (full-text article views including HTML views, PDF and ePub downloads, according to the available data) and Abstracts Views on Vision4Press platform.
Data correspond to usage on the plateform after 2015. The current usage metrics is available 48-96 hours after online publication and is updated daily on week days.
Initial download of the metrics may take a while.