Fig. 5
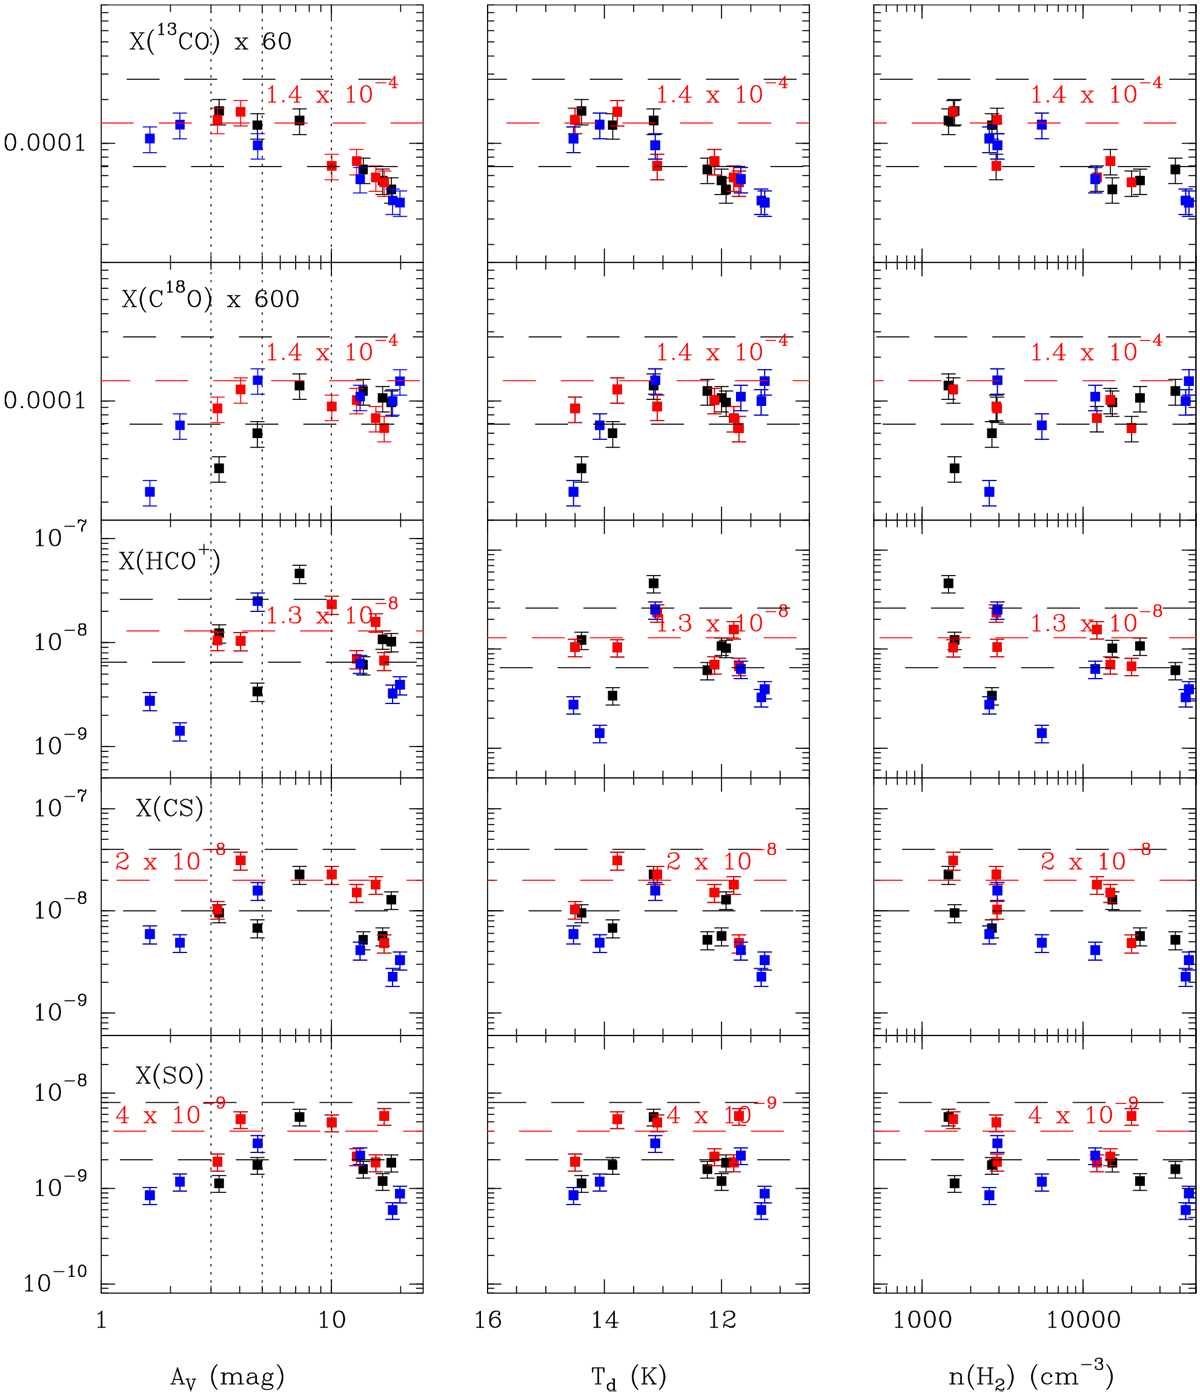
Estimated molecular abundances with respect to H2 for the three studied cuts, TMC 1-CP (black squares), TMC 1-NH3 (red) and TMC 1-C (blue) as a function of the visual extinction (left panel), dust temperature (center panel) and molecular hydrogen densities (right panel). The horizontal lines indicate a representative value in the translucent part (red dashed line) and a variation of a factor of 2 relative to it (black dashed lines). Vertical lines mark AV = 3, 5, and 10 mag.
Current usage metrics show cumulative count of Article Views (full-text article views including HTML views, PDF and ePub downloads, according to the available data) and Abstracts Views on Vision4Press platform.
Data correspond to usage on the plateform after 2015. The current usage metrics is available 48-96 hours after online publication and is updated daily on week days.
Initial download of the metrics may take a while.