Fig. 2
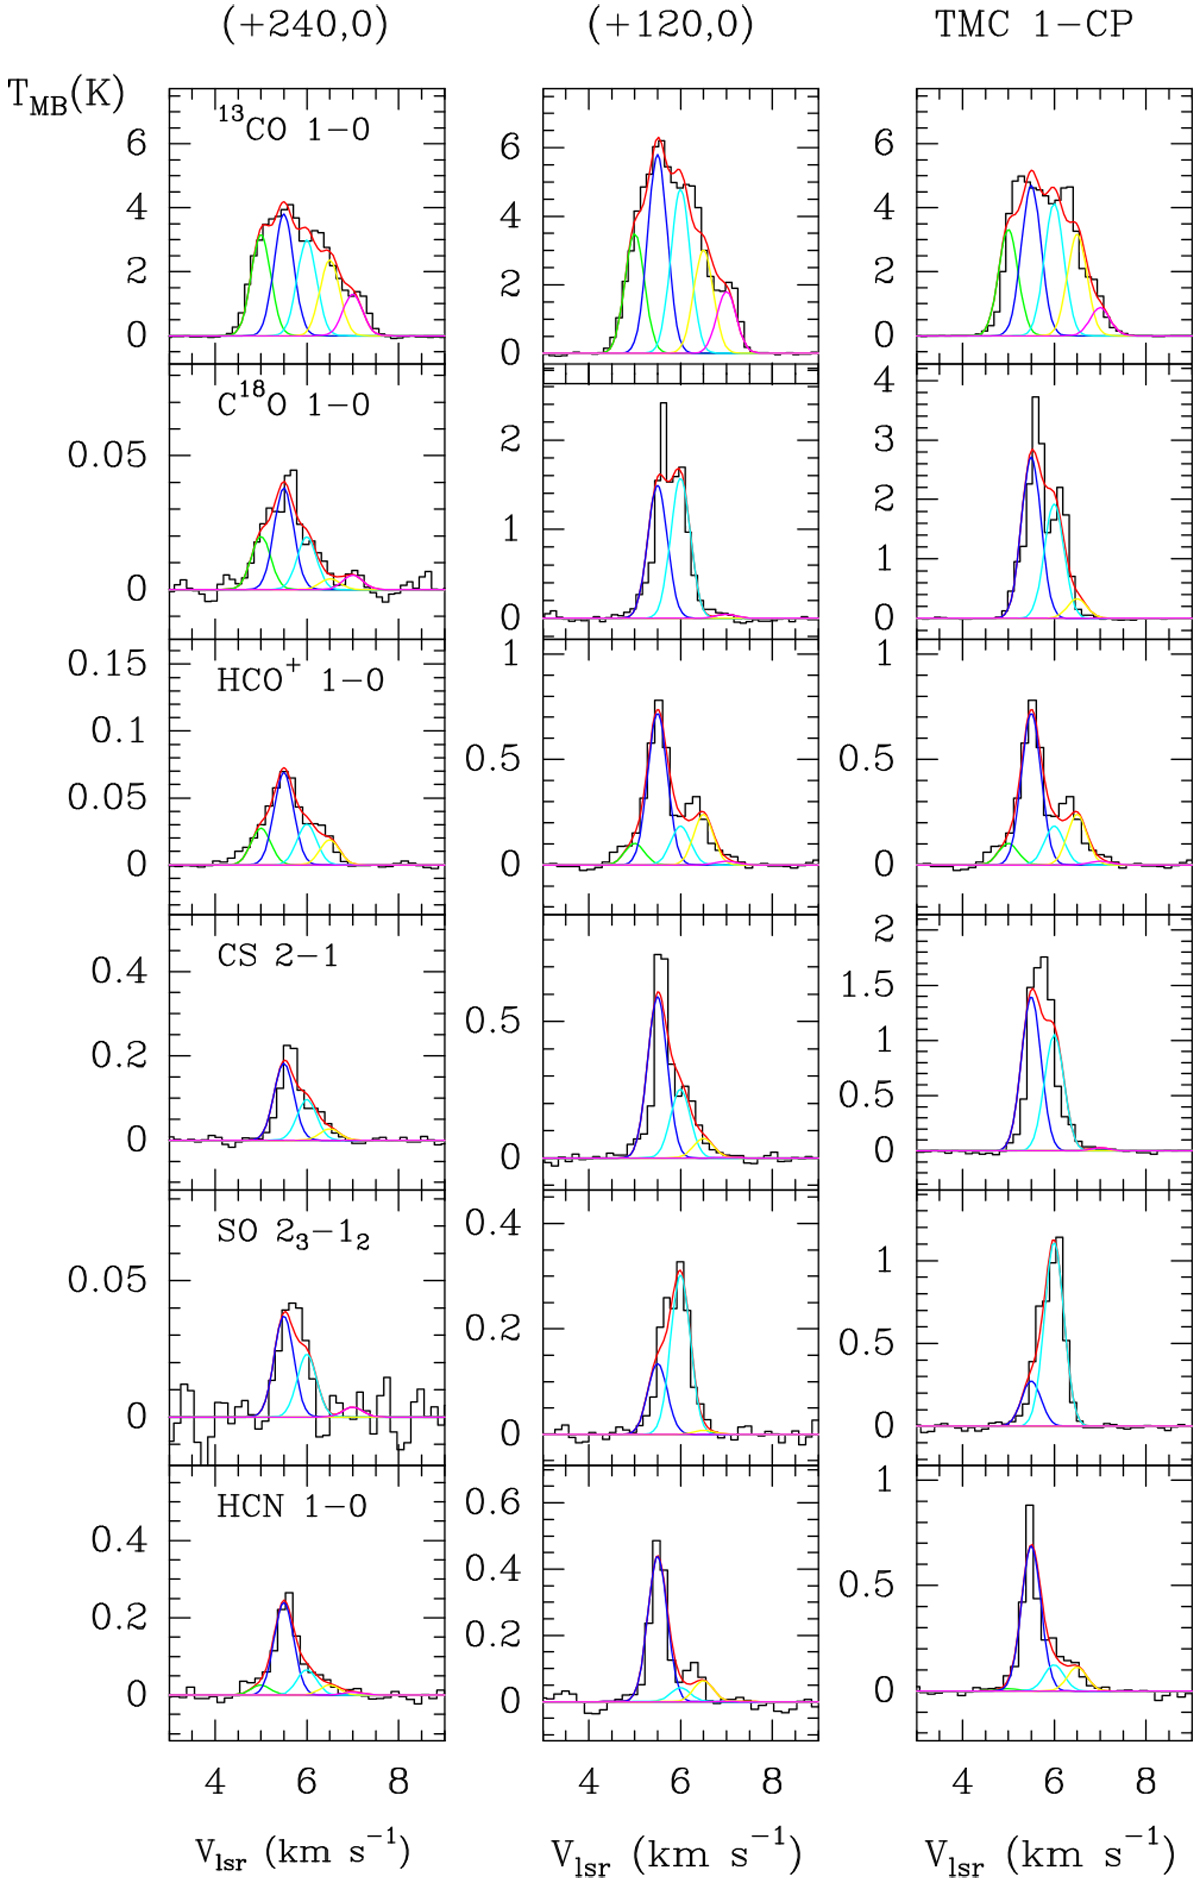
Selection of 30 m spectra towards the offsets (+240′′,0), (120′′,0) and (0,0) in the TMC 1-CP cut. In order to investigate the velocity structure we have fitted the observed line profiles with 5 Gaussians with a fixed linewidth of 0.5 km s−1, each centered at the velocities 5.0 (green), 5.5 (dark blue), 6.0 (light blue), 6.5 (yellow) and 7.0 km s−1 (fuchsia).
Current usage metrics show cumulative count of Article Views (full-text article views including HTML views, PDF and ePub downloads, according to the available data) and Abstracts Views on Vision4Press platform.
Data correspond to usage on the plateform after 2015. The current usage metrics is available 48-96 hours after online publication and is updated daily on week days.
Initial download of the metrics may take a while.