Fig. 11
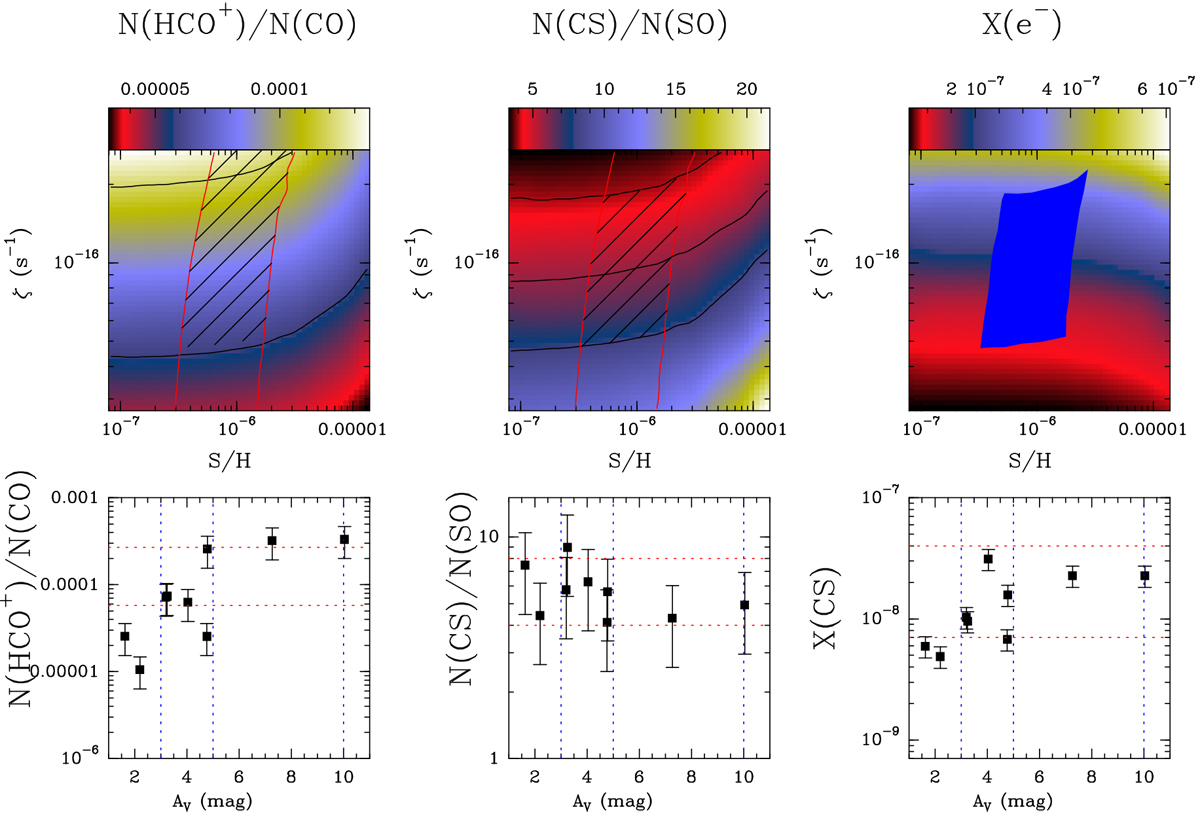
Left: the color map shows the N(HCO+)/N(CO) ratio as a function of ![]() and S/H. Black contours correspond to N(HCO+)/N(CO) = 5.8 × 10⁻⁵ and 1.2 × 10⁻⁴. Red contours indicate X(CS) = 1 × 10⁻⁸ and 4 × 10⁻⁸, which is the range of CS abundances derived in the translucent part. Center: the color map shows the N(CS)/N(SO) ratio as a functionof
and S/H. Black contours correspond to N(HCO+)/N(CO) = 5.8 × 10⁻⁵ and 1.2 × 10⁻⁴. Red contours indicate X(CS) = 1 × 10⁻⁸ and 4 × 10⁻⁸, which is the range of CS abundances derived in the translucent part. Center: the color map shows the N(CS)/N(SO) ratio as a functionof ![]() and S/H. Contours are N(CS)/N(SO) = 4, 5.8 and 8. Red contours are the same as in the left panel. Right: gas ionization fraction, X(e−) = n(e−)/nH, as a functionof
and S/H. Contours are N(CS)/N(SO) = 4, 5.8 and 8. Red contours are the same as in the left panel. Right: gas ionization fraction, X(e−) = n(e−)/nH, as a functionof ![]() and S/H. According with our data, the blue region marks the range of values expected in the translucent part of TMC 1. Bottom panels: observed values in the translucent cloud. Dashed red lines are: 5.8 × 10⁻⁵ and 2.7 × 10⁻⁴ in the N(HCO+)/N(CO) panel; 4 and 8 in the N(CS)/N(SO) panel and 7 × 10⁻⁹ and 4 × 10⁻⁸ in the X(CS) panel.
and S/H. According with our data, the blue region marks the range of values expected in the translucent part of TMC 1. Bottom panels: observed values in the translucent cloud. Dashed red lines are: 5.8 × 10⁻⁵ and 2.7 × 10⁻⁴ in the N(HCO+)/N(CO) panel; 4 and 8 in the N(CS)/N(SO) panel and 7 × 10⁻⁹ and 4 × 10⁻⁸ in the X(CS) panel.
Current usage metrics show cumulative count of Article Views (full-text article views including HTML views, PDF and ePub downloads, according to the available data) and Abstracts Views on Vision4Press platform.
Data correspond to usage on the plateform after 2015. The current usage metrics is available 48-96 hours after online publication and is updated daily on week days.
Initial download of the metrics may take a while.