Free Access
Fig. 2.
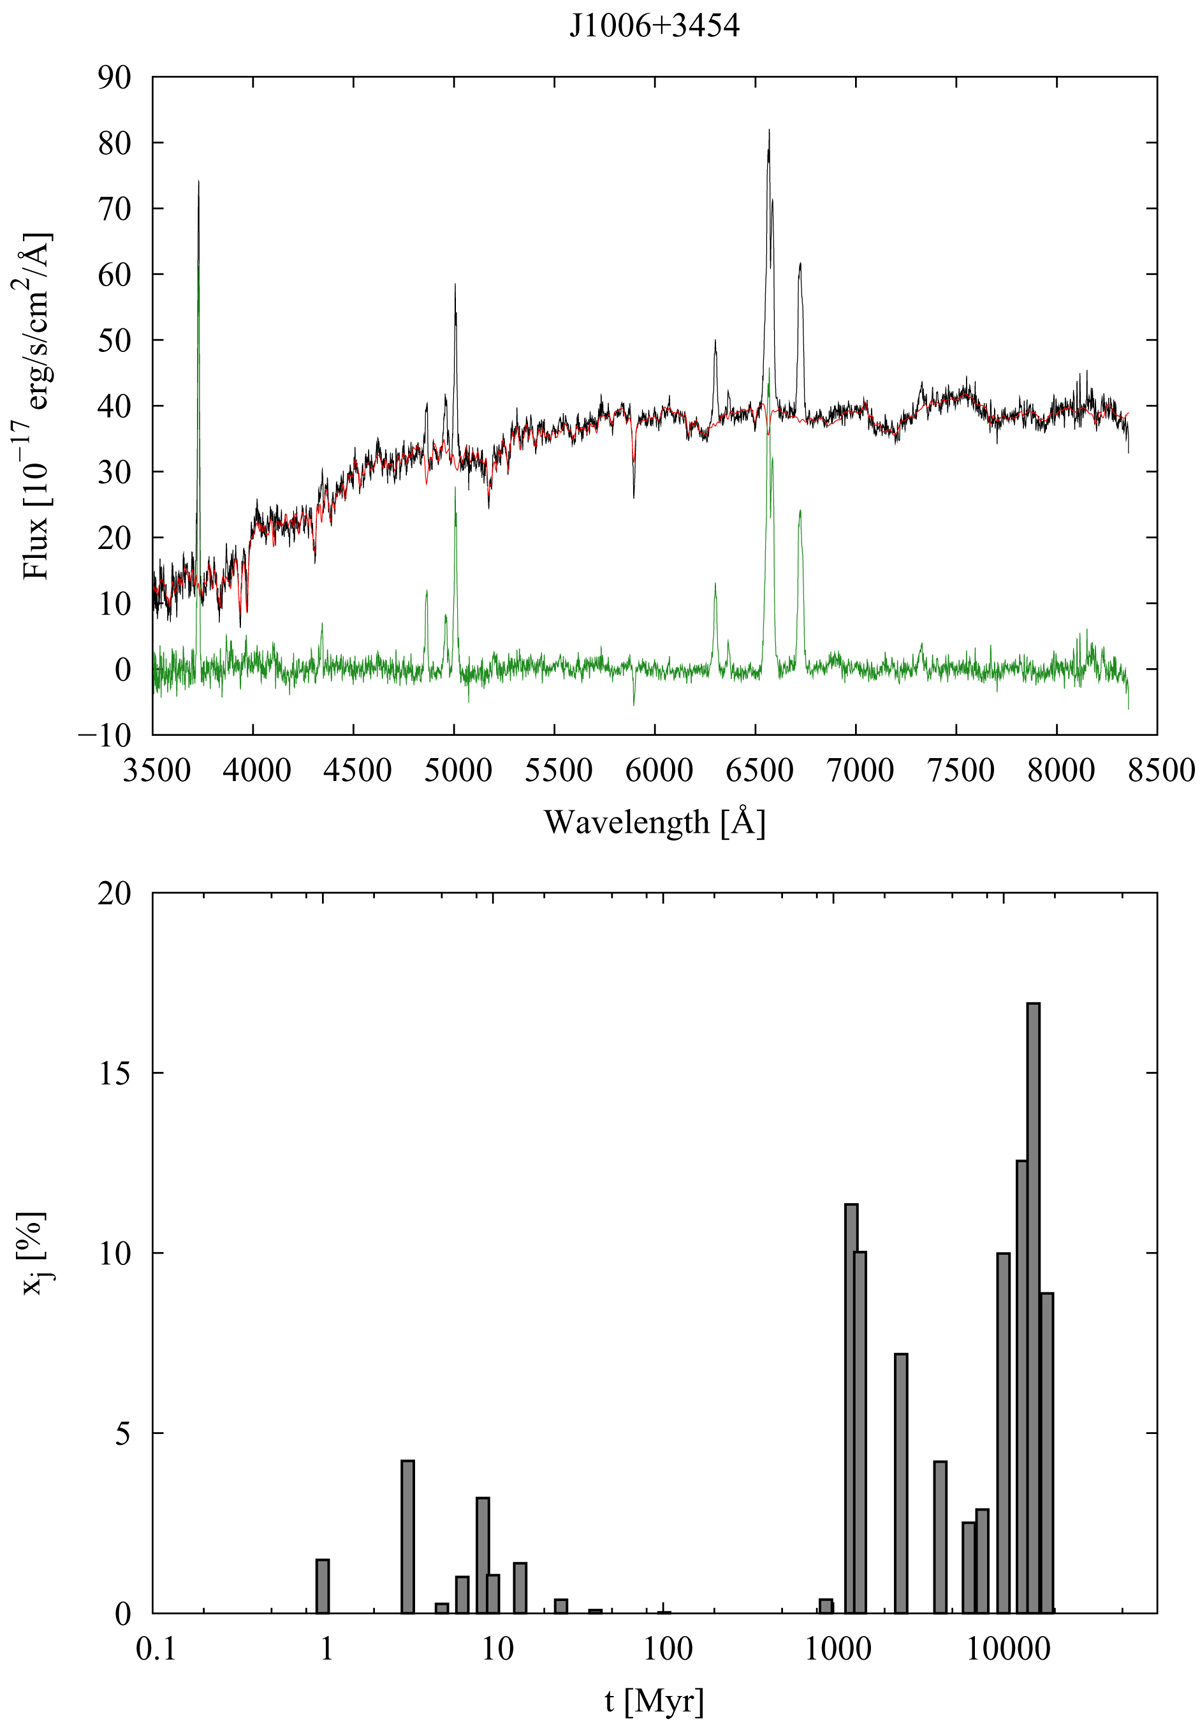
Spectral modelling using STARLIGHT synthesis code for J1006+3454 GRG. Top: observed spectrum is ploted by black colour, modelled spectrum by red and residual spectrum by the green colour. Bottom: age distribution in the light fraction population vector.
Current usage metrics show cumulative count of Article Views (full-text article views including HTML views, PDF and ePub downloads, according to the available data) and Abstracts Views on Vision4Press platform.
Data correspond to usage on the plateform after 2015. The current usage metrics is available 48-96 hours after online publication and is updated daily on week days.
Initial download of the metrics may take a while.