Fig. 11
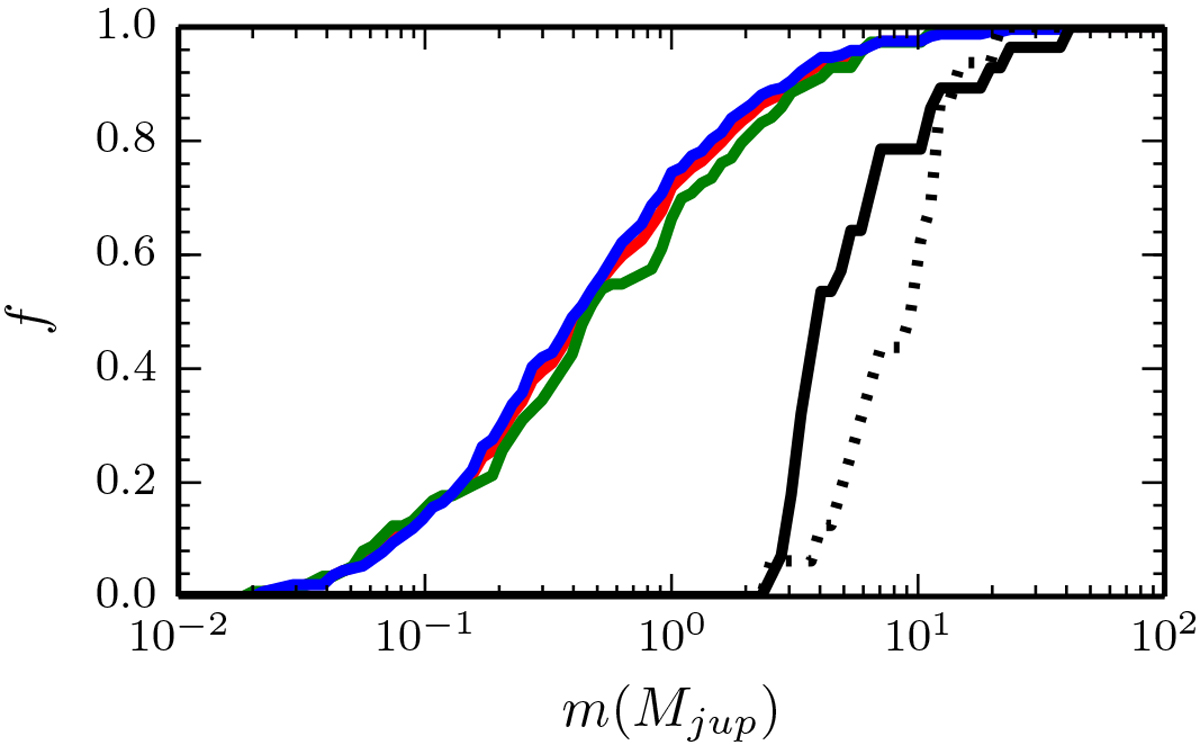
Cumulative distribution of the masses of all planets (red), the free-floating planets that are bound to the cluster (green), and those unbound from the cluster (blue). These three curves are statistically indistinguishable. The dotted curve indicates the mass distribution of 16 observed potential free-floating planets from Luhman et al. (2005); Marsh et al. (2010); Zapatero Osorio et al. (2000); Delorme et al. (2012); Liu et al. (2013); Gagné et al. (2014a,b,c, 2015); Schneider et al. (2014, 2016); Luhman (2014); Liu et al. (2016); Kellogg et al. (2016). For a different comparison, we introduce a lower mass cutoff to the initial sample of planets of 2 MJup and compare this with the observed sample (black).
Current usage metrics show cumulative count of Article Views (full-text article views including HTML views, PDF and ePub downloads, according to the available data) and Abstracts Views on Vision4Press platform.
Data correspond to usage on the plateform after 2015. The current usage metrics is available 48-96 hours after online publication and is updated daily on week days.
Initial download of the metrics may take a while.