Fig. 8
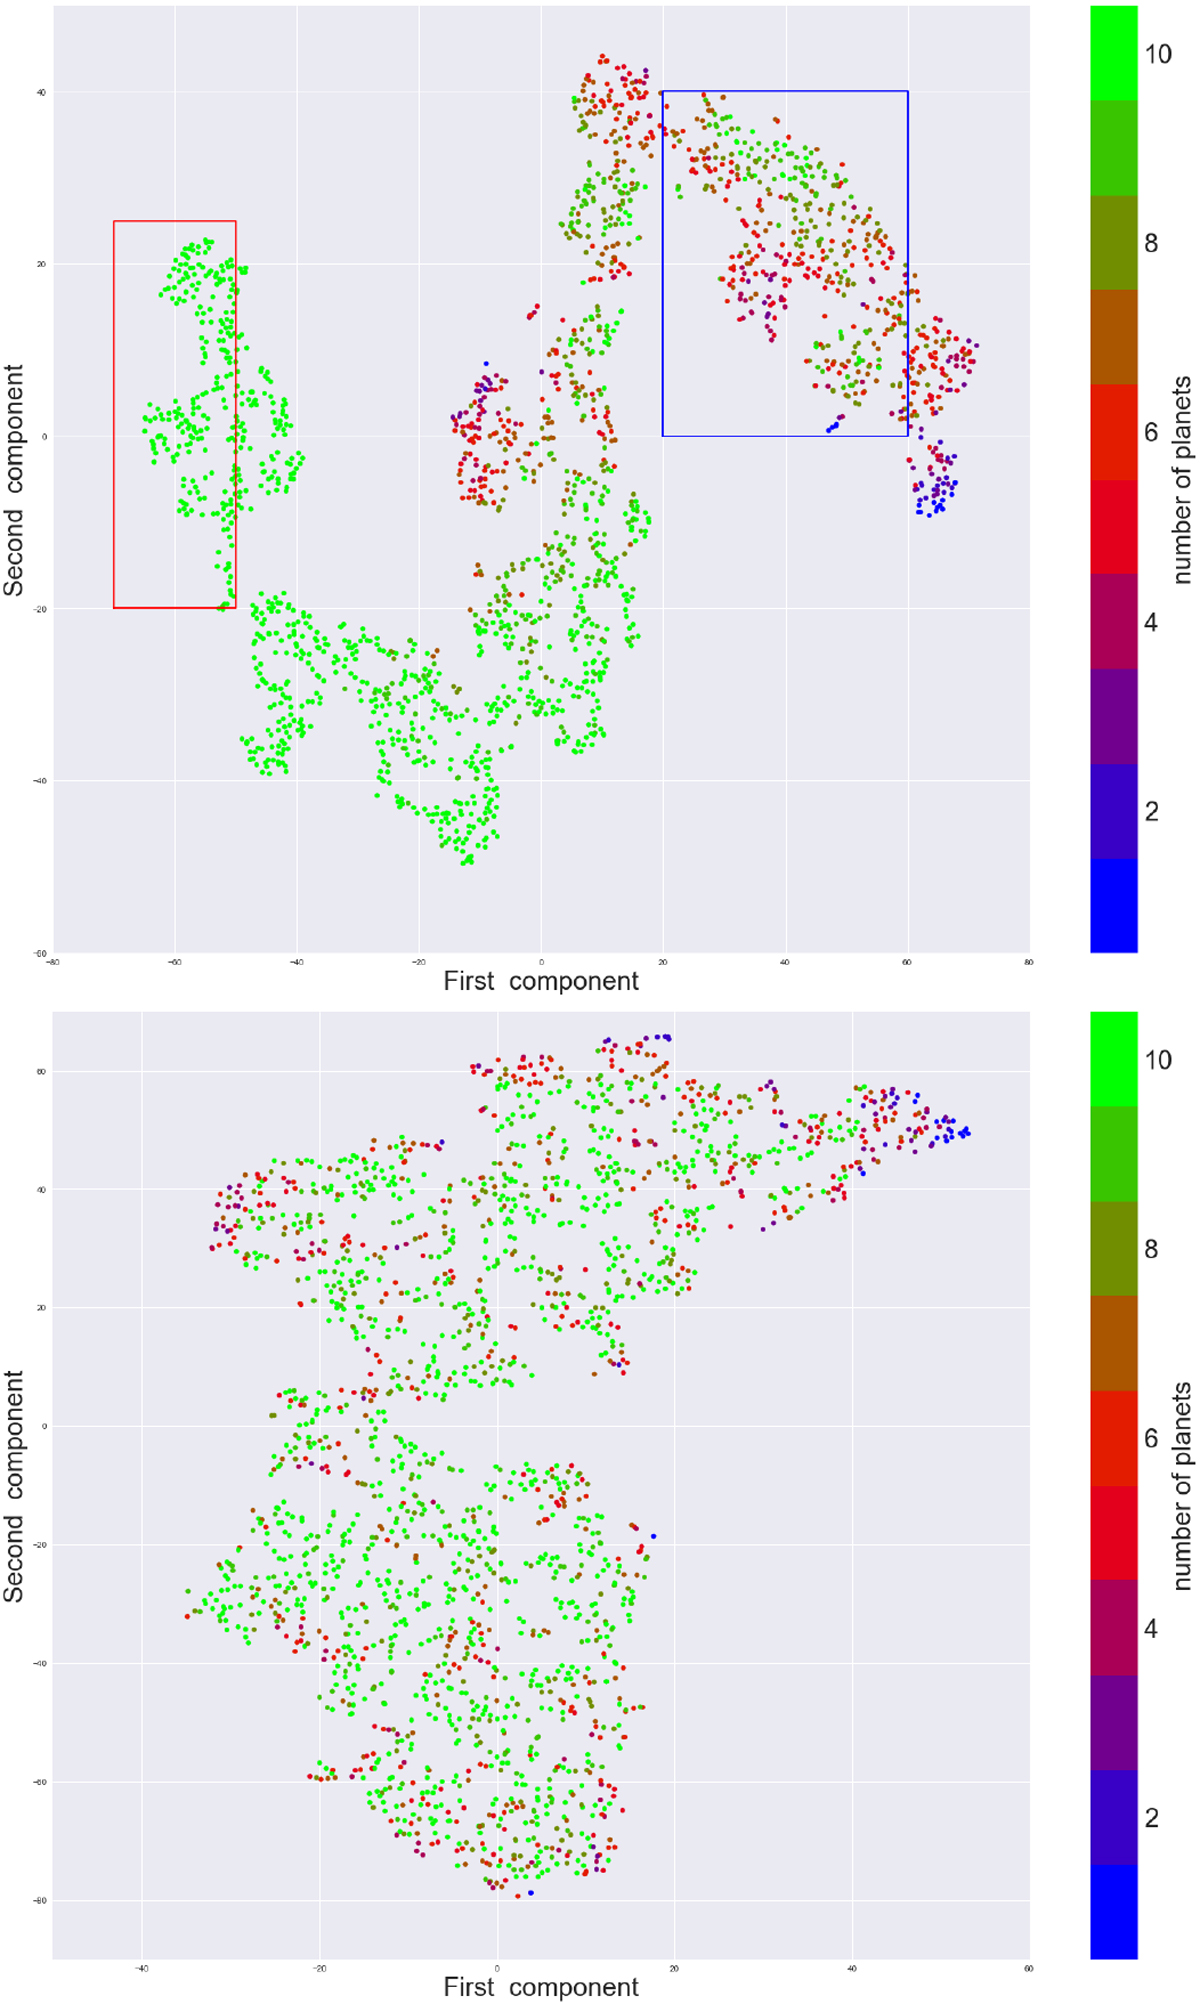
T-SNE visualisation of the reference population (upper panel) and the non-physical population (lower panel). The colour-coding indicates the number of planets that remain at the end of the planetary system formation model. The blue and red rectangles indicate two sub-classes of systems whose properties are compared in Figs. 9 and 10; see text for details.
Current usage metrics show cumulative count of Article Views (full-text article views including HTML views, PDF and ePub downloads, according to the available data) and Abstracts Views on Vision4Press platform.
Data correspond to usage on the plateform after 2015. The current usage metrics is available 48-96 hours after online publication and is updated daily on week days.
Initial download of the metrics may take a while.