Fig. 3
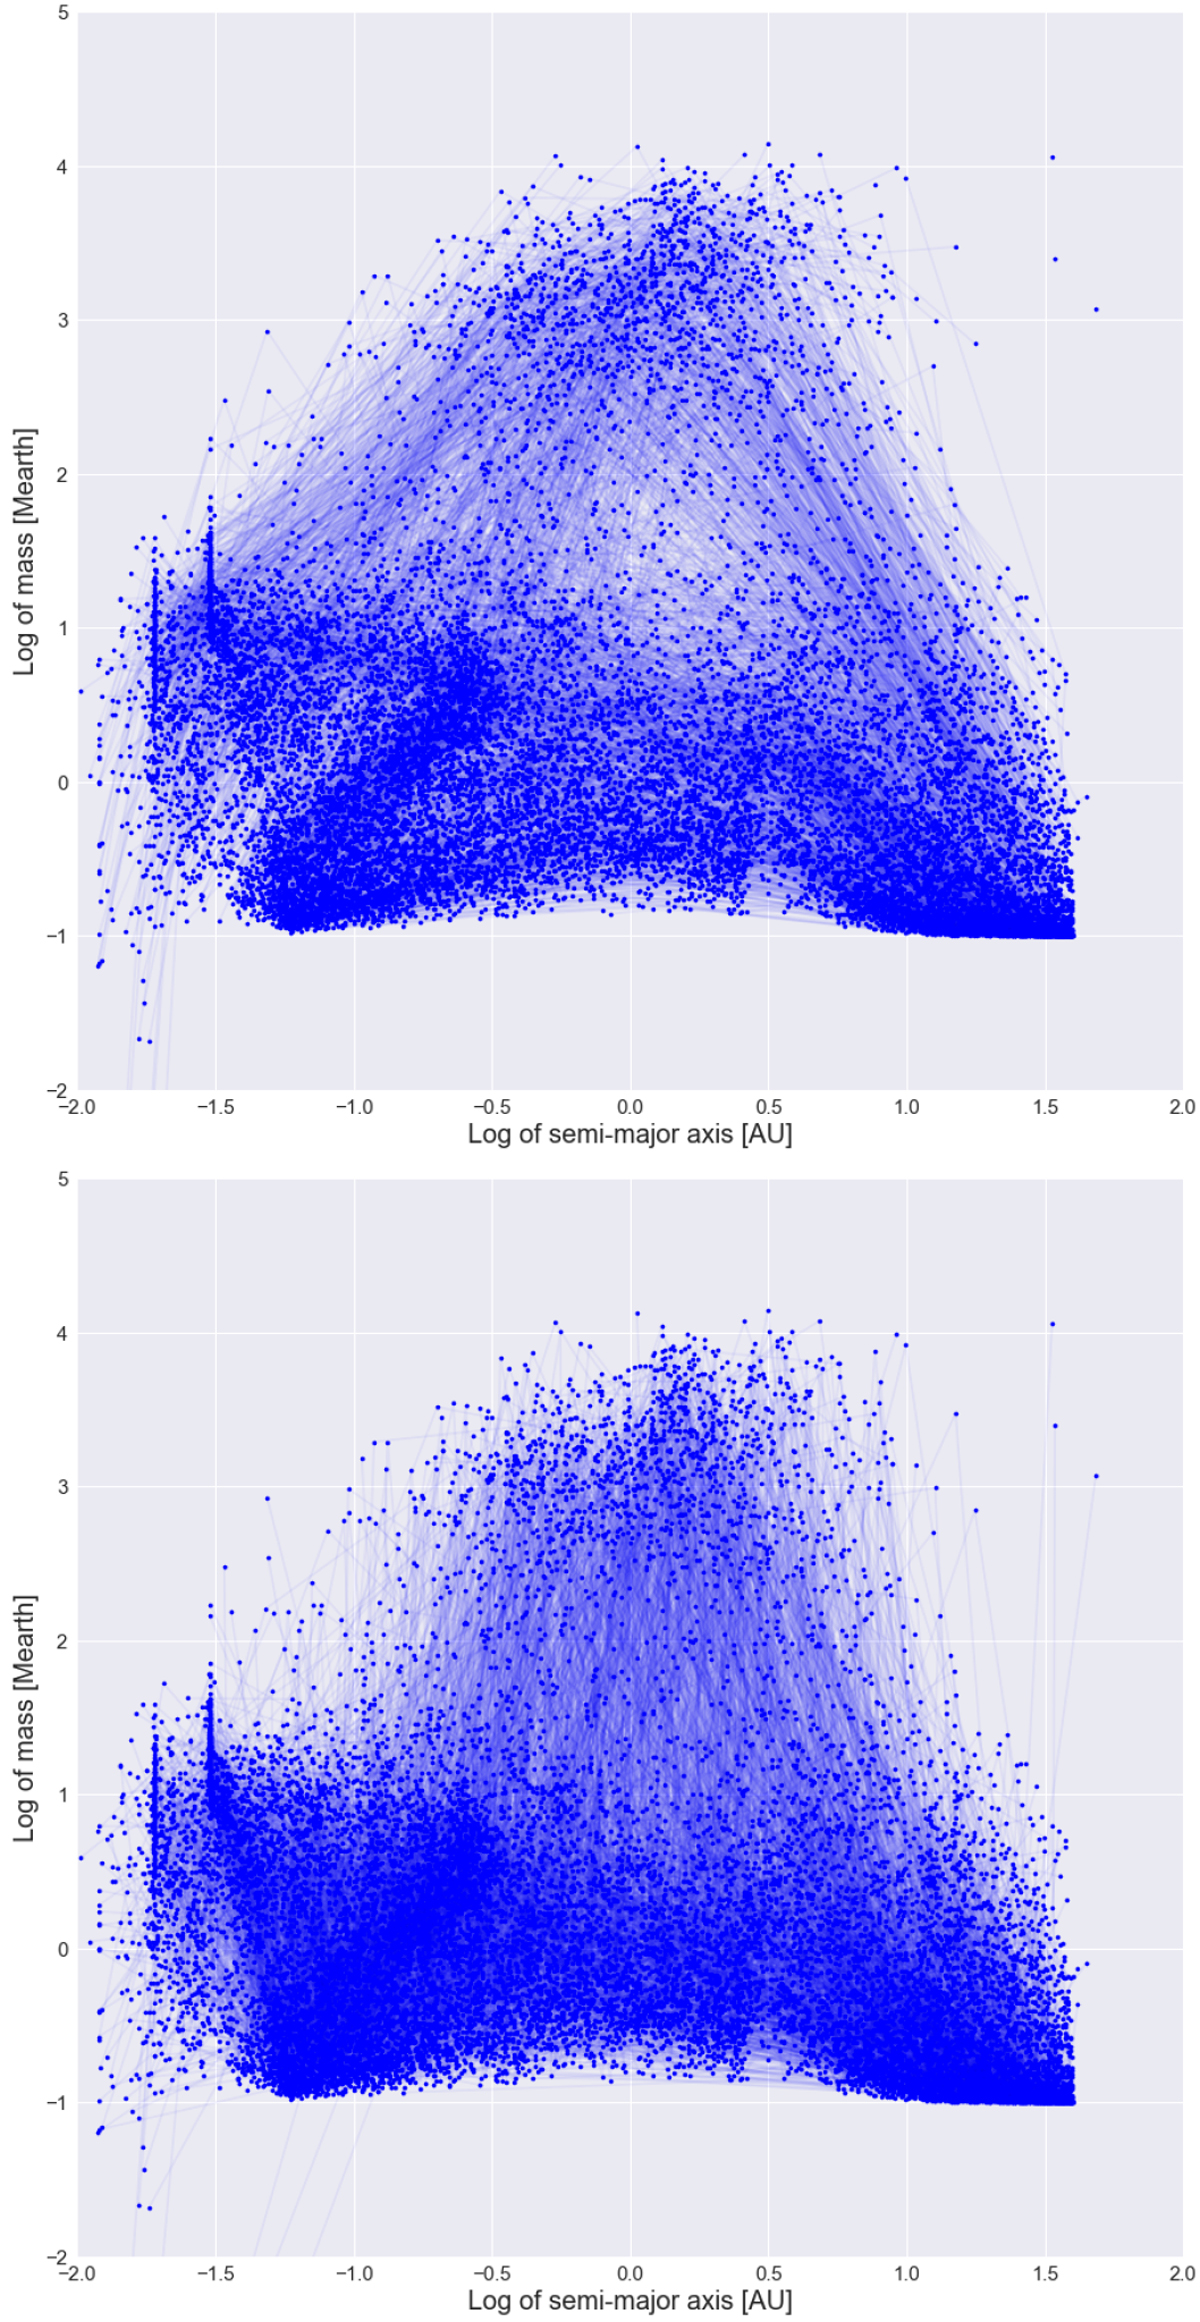
Reference population (upper panel) and non-physical population (bottom panel). In each panel, planets are represented by points in the log a– log M space (whereM is in M⊕ and a is in AU). Planets belonging to the same system are linked by a line; a planetary system is therefore represent by a broken line with up to nine changes of slope.
Current usage metrics show cumulative count of Article Views (full-text article views including HTML views, PDF and ePub downloads, according to the available data) and Abstracts Views on Vision4Press platform.
Data correspond to usage on the plateform after 2015. The current usage metrics is available 48-96 hours after online publication and is updated daily on week days.
Initial download of the metrics may take a while.