Fig. 5.
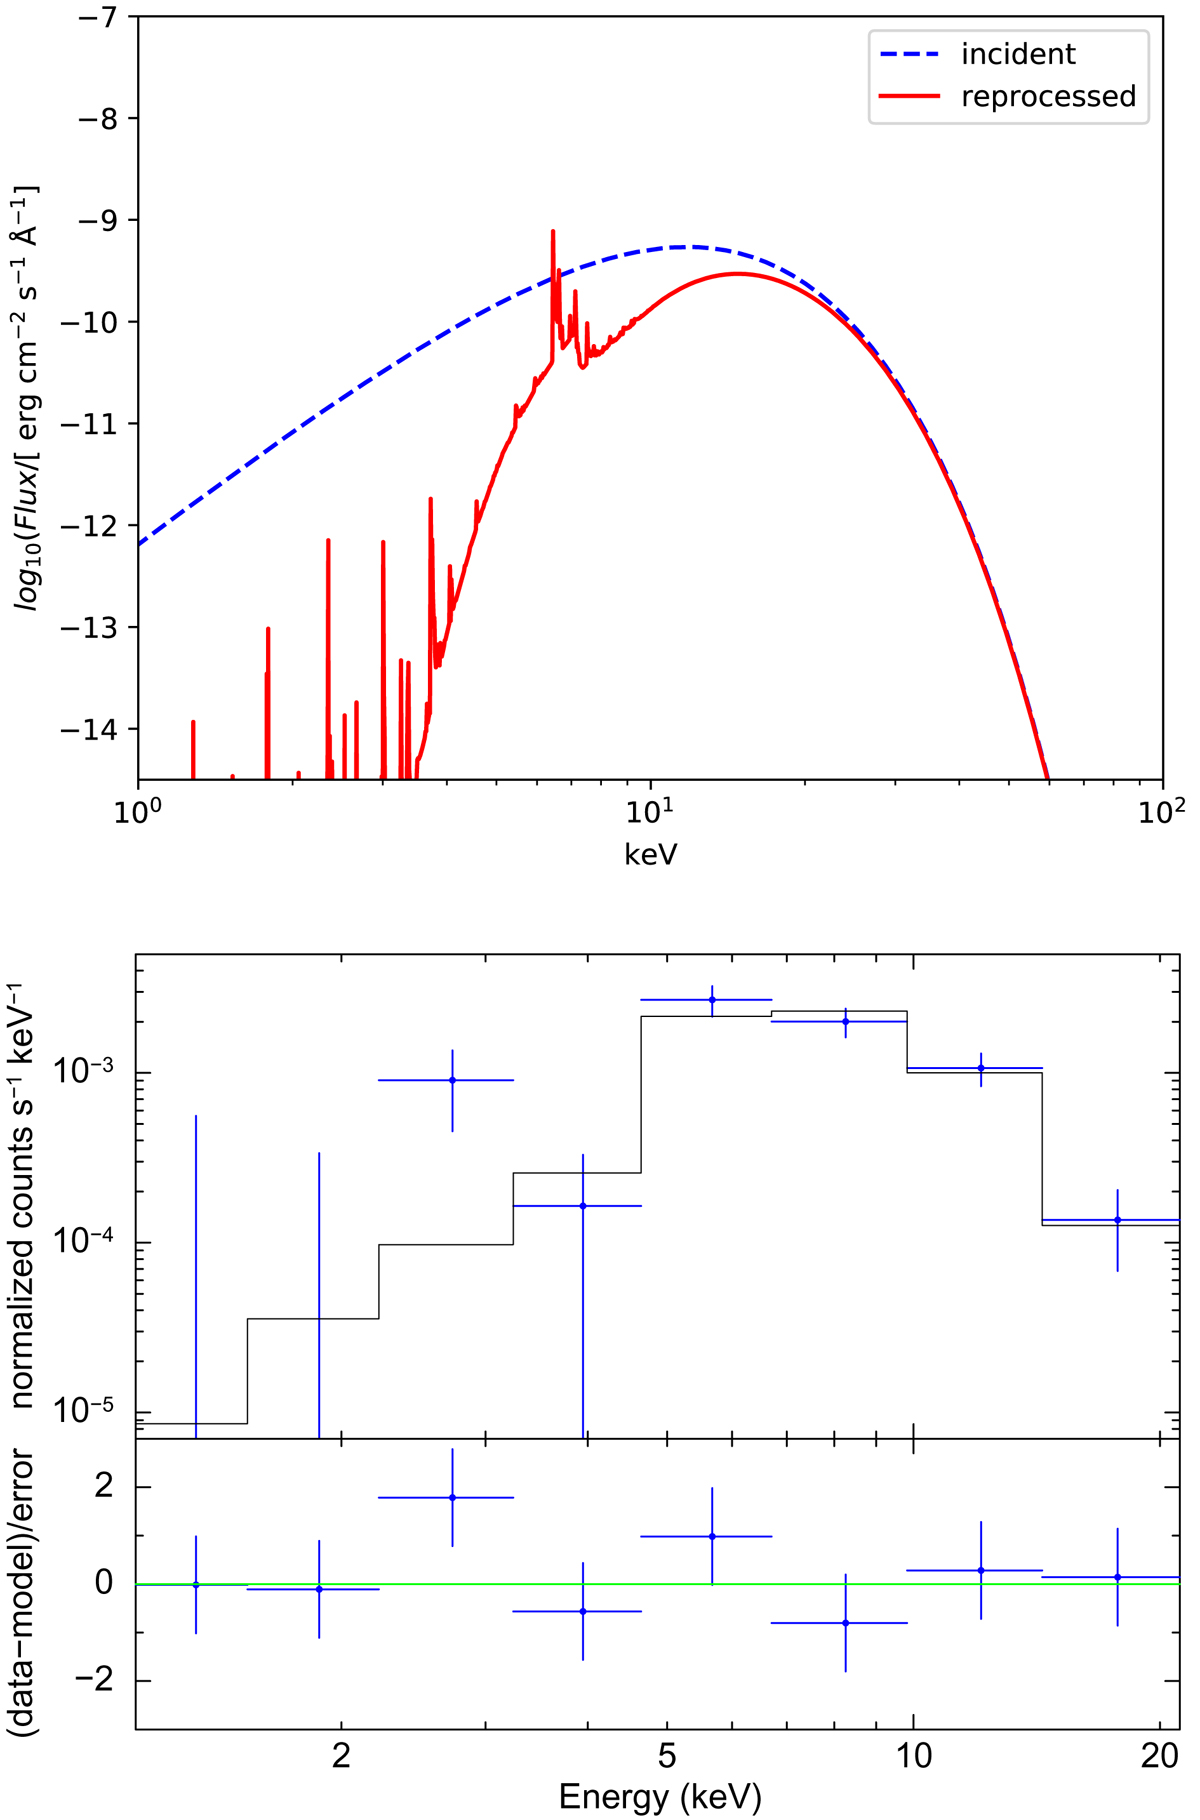
Top panel: comparison between the kT = 2.4 keV black-body spectrum adopted as input in our CLOUDY simulations (blue dashed line) and the spectrum emerging from the photoionized circumstellar disc seen edge-on (red solid line). Bottom panel: simulated spectrum of A0538−66 based on the spectrum emerging from the nebula, after reprocessing took place (solid red line from top panel), for a 4328 s Einstein/MPC observation fitted with an absorbed (![]() cm−2) black body (kT = 2.2 ± 0.6 keV; errors at 1σ confidence level).
cm−2) black body (kT = 2.2 ± 0.6 keV; errors at 1σ confidence level).
Current usage metrics show cumulative count of Article Views (full-text article views including HTML views, PDF and ePub downloads, according to the available data) and Abstracts Views on Vision4Press platform.
Data correspond to usage on the plateform after 2015. The current usage metrics is available 48-96 hours after online publication and is updated daily on week days.
Initial download of the metrics may take a while.