Free Access
Fig. 1.
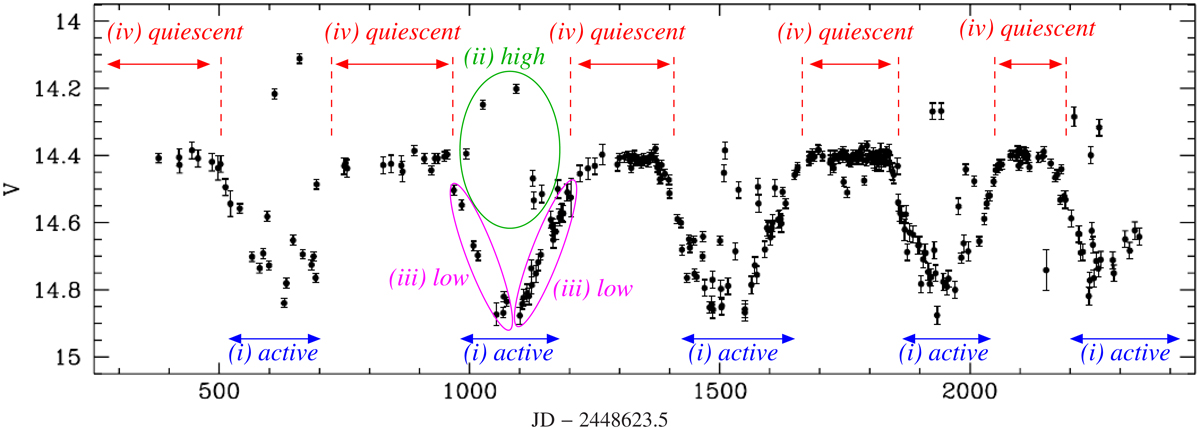
V-band light curve of A0538−66 from MACHO project observations (figure adapted from Fig. 1 in Alcock et al. 2001). The quiescent, active states (low and high) of the McGowan & Charles (2003) and Alcock et al. (2001) model are shown.
Current usage metrics show cumulative count of Article Views (full-text article views including HTML views, PDF and ePub downloads, according to the available data) and Abstracts Views on Vision4Press platform.
Data correspond to usage on the plateform after 2015. The current usage metrics is available 48-96 hours after online publication and is updated daily on week days.
Initial download of the metrics may take a while.