Fig. B.1.
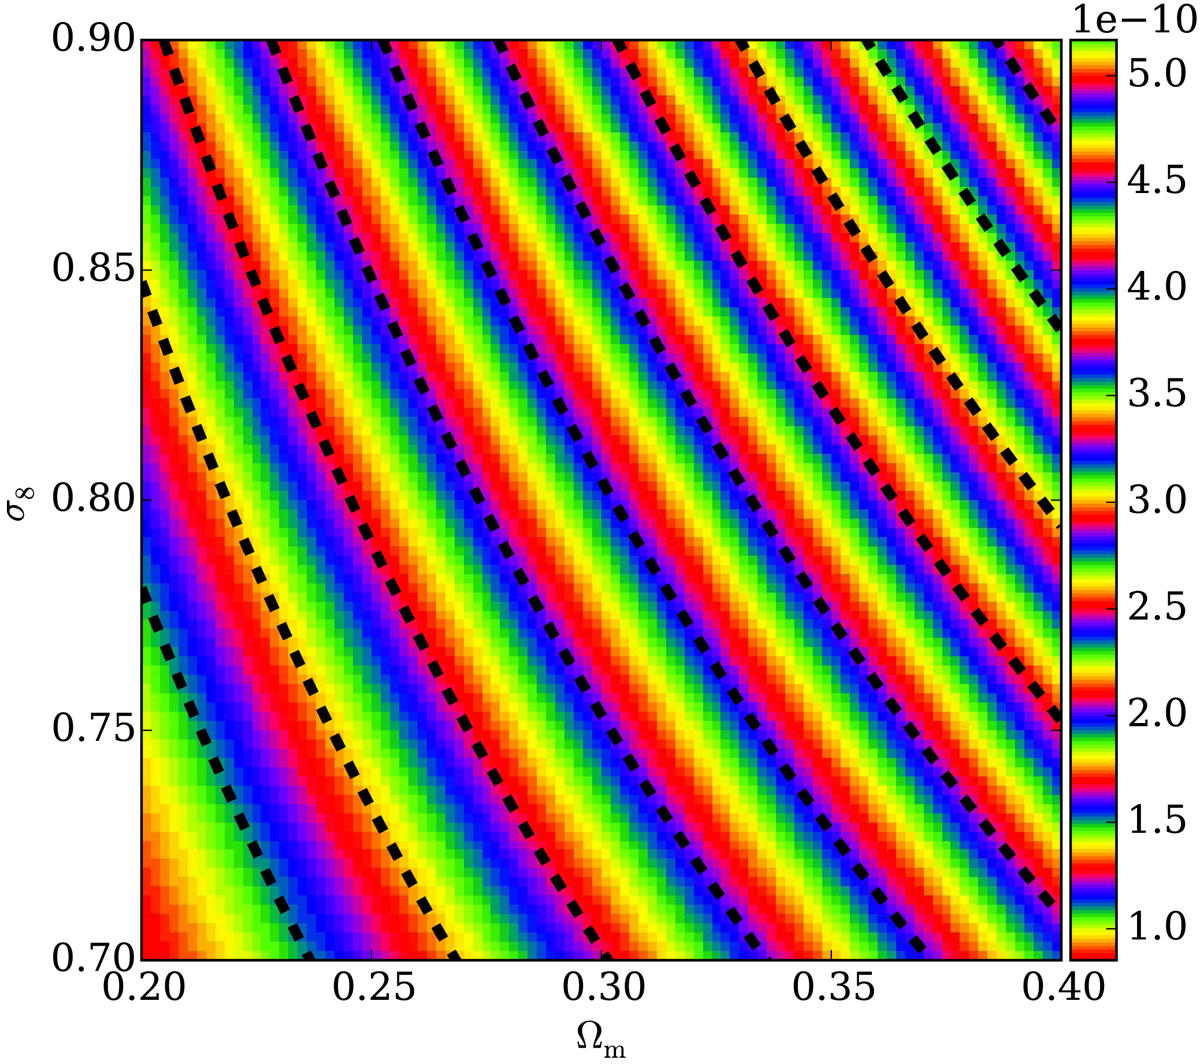
Degeneracy direction of σ8 and Ωm for a CCOSEBIs analysis of the KiDS-like data. The colours in the image show the value of the CCOSEBIs Eσ8 mode, in comparison to dashed lines of constant Σ8 = σ8(Ωm/0.3)α with α = 0.65. The repeating color scheme was chosen to capture the variations in the values of Eσ8. The lower left corner has the smallest value of Eσ8 which gradually increases, perpendicular to the dashed curves, towards the upper right corner.
Current usage metrics show cumulative count of Article Views (full-text article views including HTML views, PDF and ePub downloads, according to the available data) and Abstracts Views on Vision4Press platform.
Data correspond to usage on the plateform after 2015. The current usage metrics is available 48-96 hours after online publication and is updated daily on week days.
Initial download of the metrics may take a while.