Fig. 7.
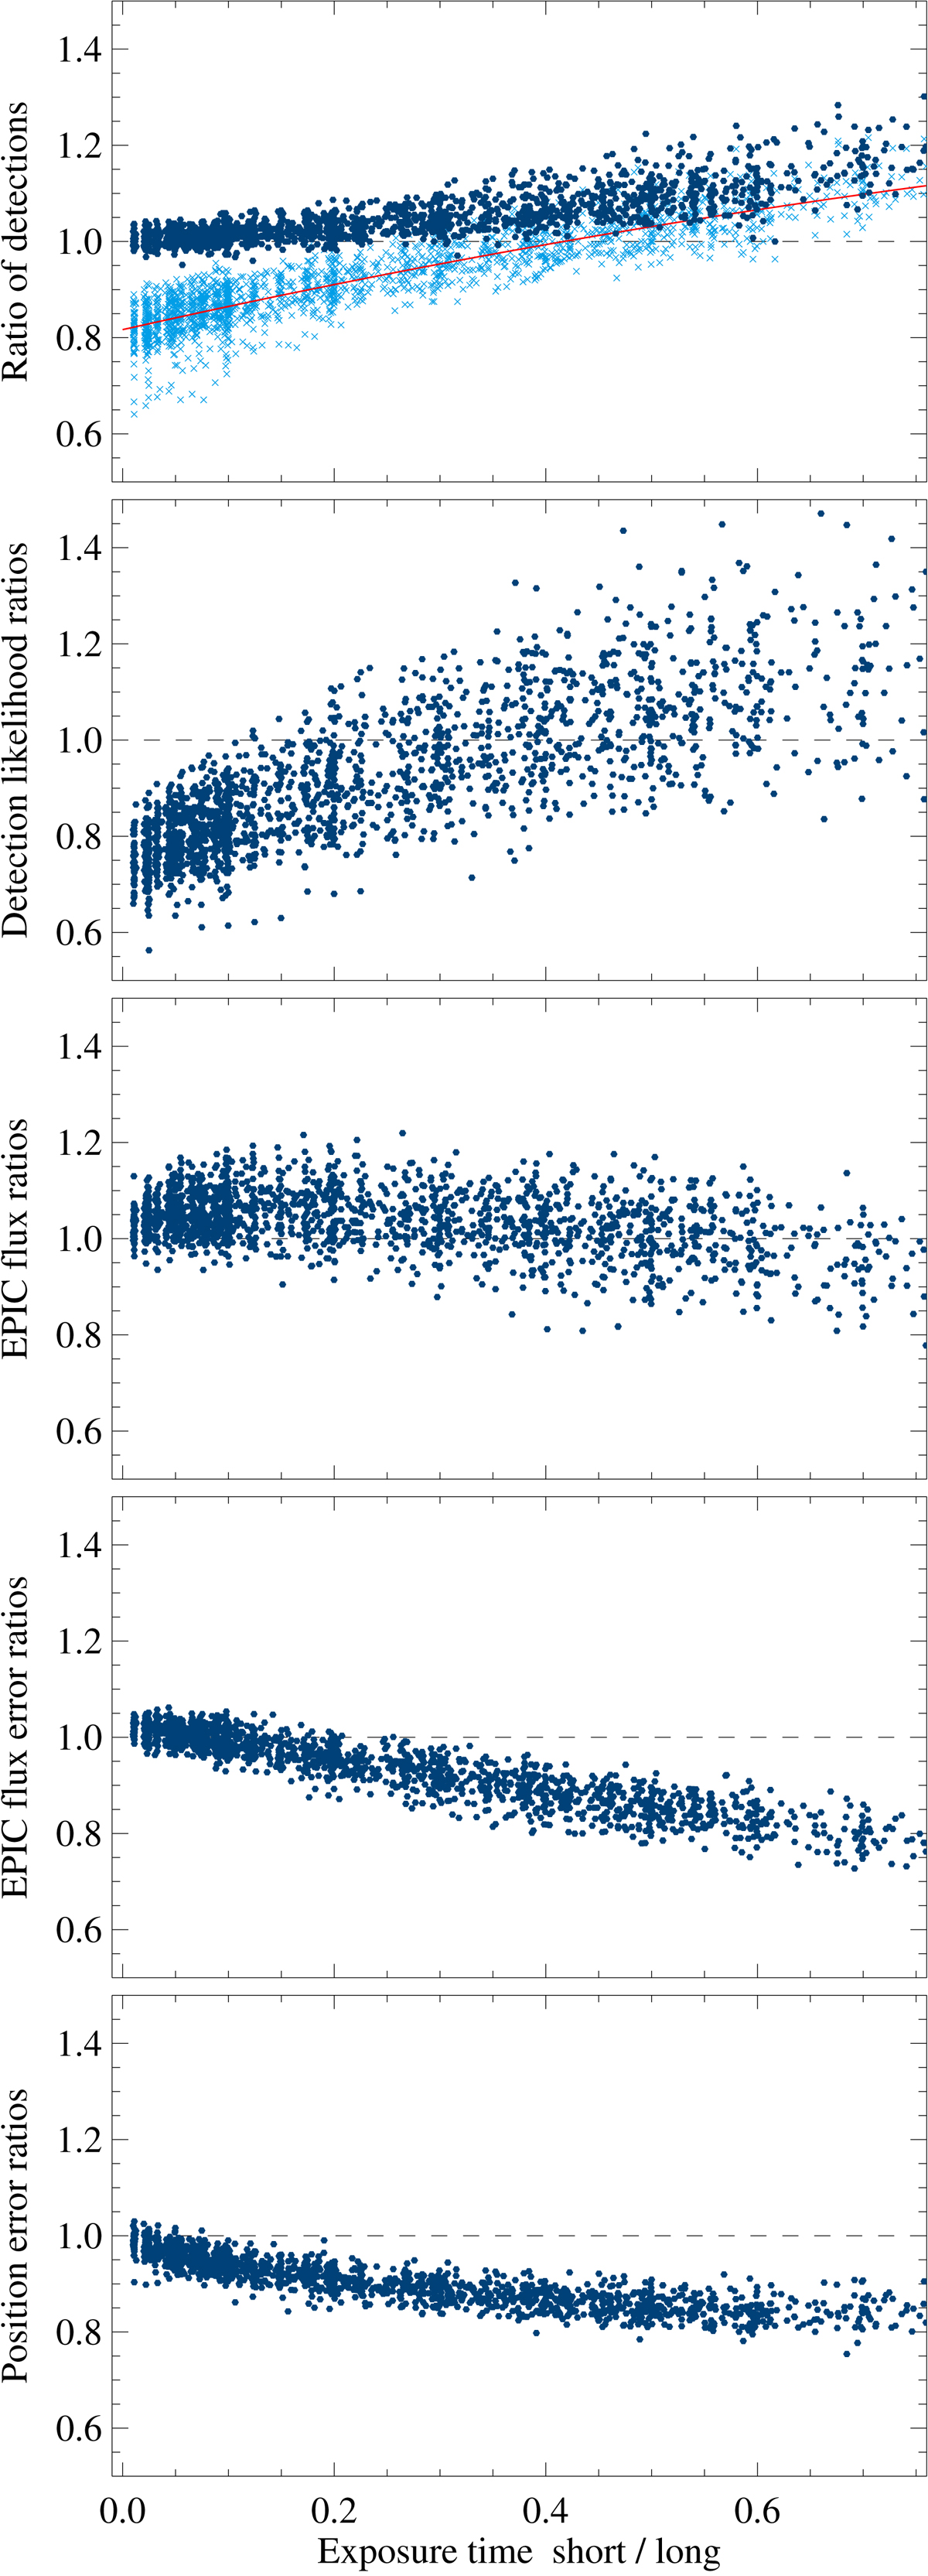
Source parameters derived from stacked source detection in a longer and a shorter part of long observations, compared to source detection in the longer part only. Each dot represents the ratio of the median values of the sources detected in one stack to the median values of the sources detected in the long sub-exposure alone. Sources with an equivalent detection likelihood above six in at least one exposure are included in the stacked source list. The light blue crosses in the uppermost panel mark the ratio of sources with a total likelihood above six. The red curve is a 2nd-order polynomial fit to guide the eye.
Current usage metrics show cumulative count of Article Views (full-text article views including HTML views, PDF and ePub downloads, according to the available data) and Abstracts Views on Vision4Press platform.
Data correspond to usage on the plateform after 2015. The current usage metrics is available 48-96 hours after online publication and is updated daily on week days.
Initial download of the metrics may take a while.