Fig. 6.
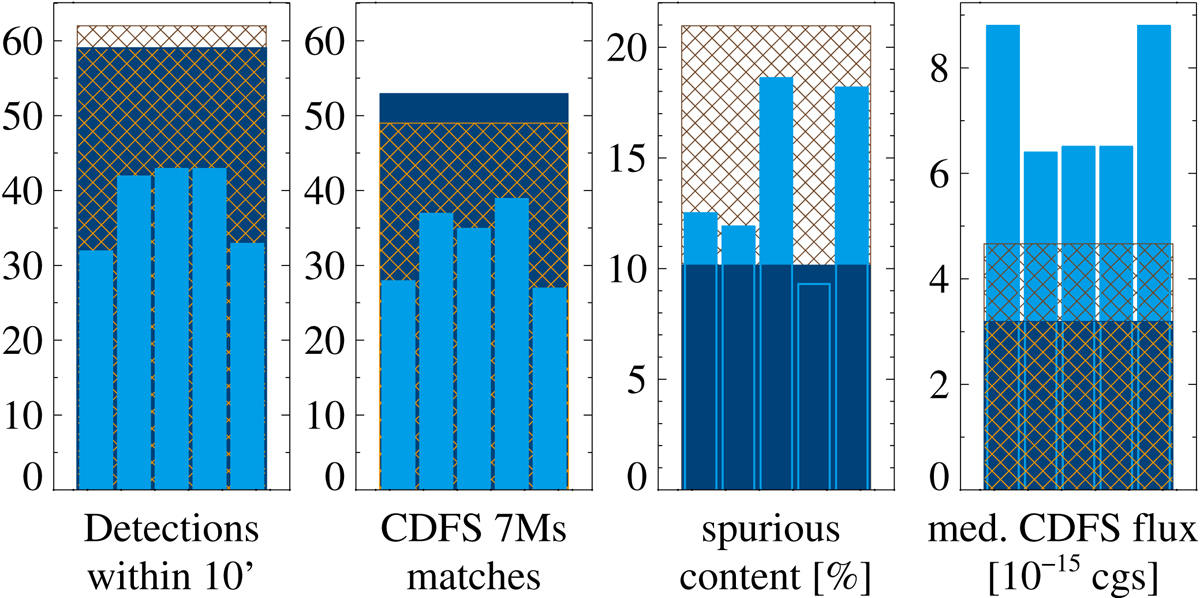
The five-component artificial stack from Fig. 5 compared to the CDFS 7 Ms catalogue within a 10′ circle. From left to right: all XMM-Newton detections, those with a Chandra match within 5″, fraction of detections without Chandra counterpart, and Chandra full-band fluxes of the matches. Dark blue bars denote the results from stacked source detection, light blue bars those from source detection on the individual sub-exposures, and orange cross-hatched bars their joined source lists.
Current usage metrics show cumulative count of Article Views (full-text article views including HTML views, PDF and ePub downloads, according to the available data) and Abstracts Views on Vision4Press platform.
Data correspond to usage on the plateform after 2015. The current usage metrics is available 48-96 hours after online publication and is updated daily on week days.
Initial download of the metrics may take a while.