Fig. 5.
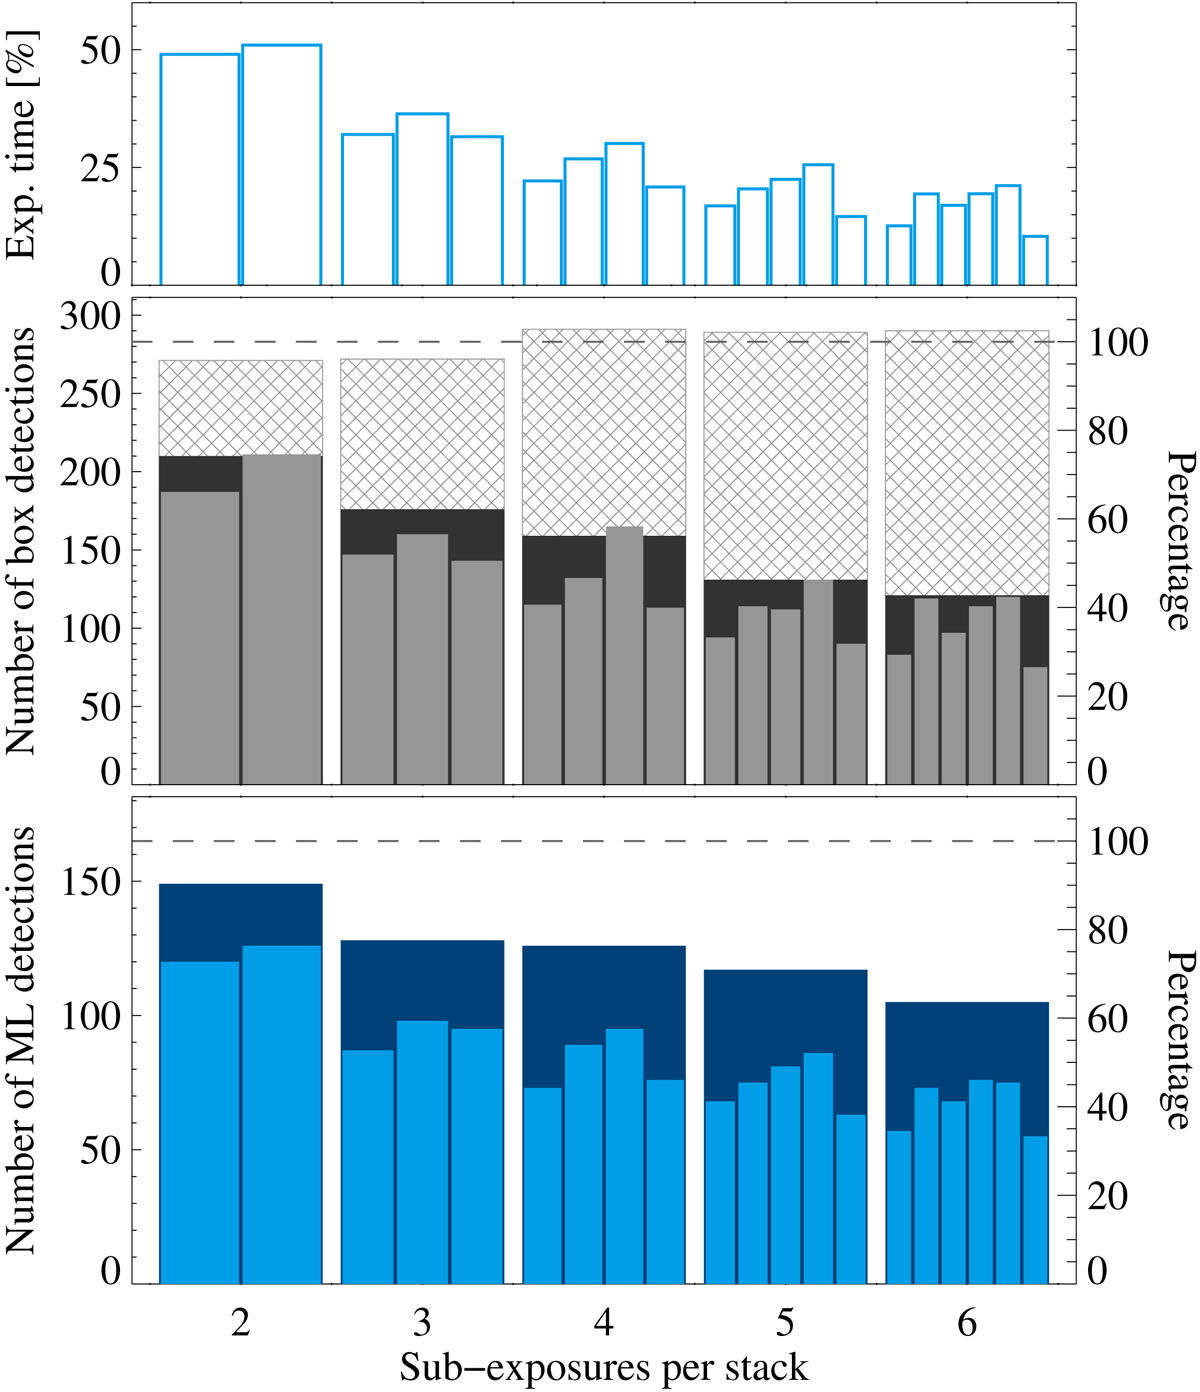
Stacked source detection on an observation split into several nearly equally long sub-exposures (obs. id. 0555780201). Upper panel: percentage of exposure time. Middle panel: sliding box detections that are submitted to emldetect. Cross-hatched bars mark those found in the fifteen mosaics of all sub-exposures, dark filled bars the detections found when running eboxdetect on all individual images simultaneously, and light filled bars the box detections in each individual sub-exposure. Lower panel: final maximum-likelihood detections with a minimum total detection likelihood of at least six in the stack (dark blue) and in the individual sub-exposures (light blue). The dashed horizontal line marks the result of source detection on the full, unsplit observation.
Current usage metrics show cumulative count of Article Views (full-text article views including HTML views, PDF and ePub downloads, according to the available data) and Abstracts Views on Vision4Press platform.
Data correspond to usage on the plateform after 2015. The current usage metrics is available 48-96 hours after online publication and is updated daily on week days.
Initial download of the metrics may take a while.