Fig. 4.
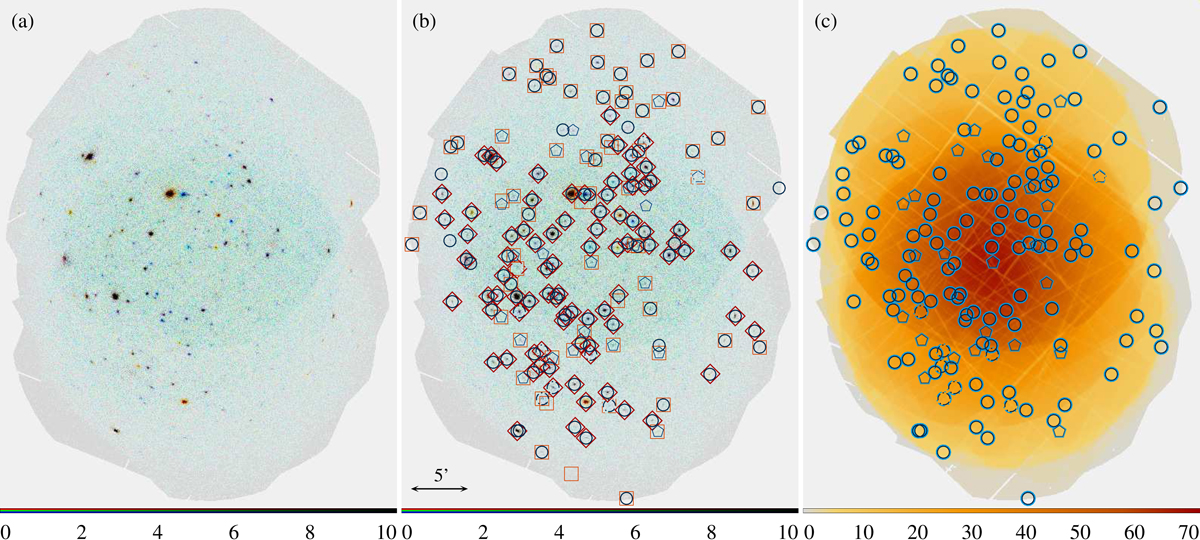
Example of stacked source detection: six overlapping observations within the Magellanic Bridge. Panel a: mosaic of all images. The three colour-coded energy bands are: 0.2−1.0 keV (red), 1.0−2.0 keV (green), 2.0−12.0 keV (blue). Colour intensity scales linearly with the number of counts. Panel b: same mosaic image with source identifications overlaid. Blue circles and pentagons: 158 sources detected by stacked source detection. Circles mark sources that exceed the likelihood threshold in total or in more than one contributing observation. Red diamonds and boxes: 152 sources detected in the individual observations. Diamonds mark sources that exceed the likelihood threshold in more than one contributing observation. Dashed symbols mark sources that have been flagged by the task dpssflag (cf. Sect. 4.1). Panel c: mosaic of the vignetted exposure maps with the identifications of the sources in the stacked catalogue, using the same symbols as in panel b. The exposure time has been averaged over the instruments and energy bands and is given in units of kiloseconds in the colour bar.
Current usage metrics show cumulative count of Article Views (full-text article views including HTML views, PDF and ePub downloads, according to the available data) and Abstracts Views on Vision4Press platform.
Data correspond to usage on the plateform after 2015. The current usage metrics is available 48-96 hours after online publication and is updated daily on week days.
Initial download of the metrics may take a while.