Fig. 3.
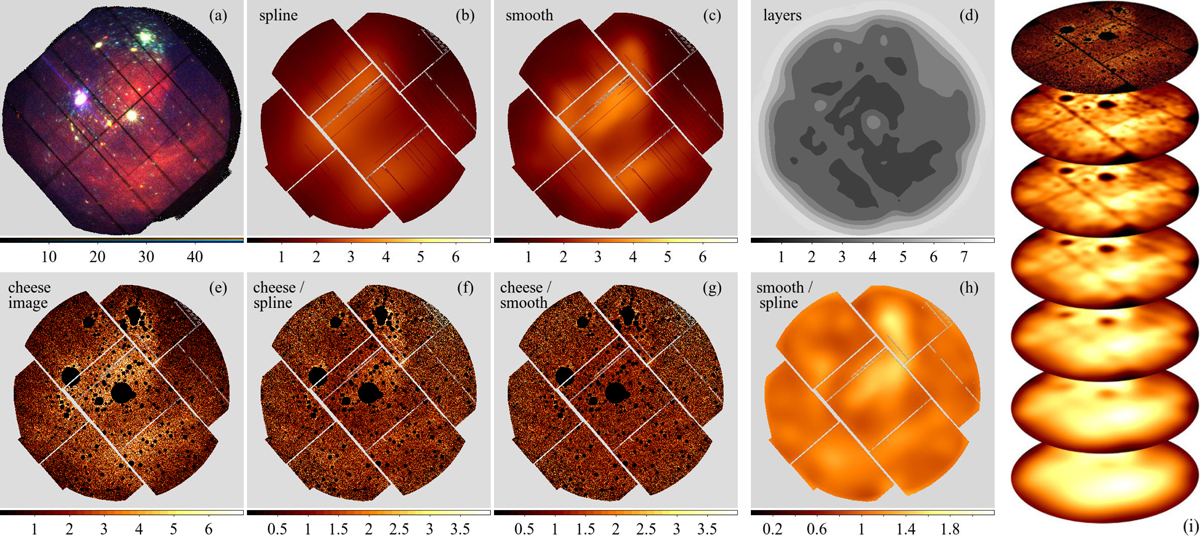
Different methods of background modelling, illustrated in the example of an observation of the η Carinae region (obs. id. 0112560101). The panels include a three-band false-colour image of the EPIC observation (0.2−1.0 keV, 1.0−2.0 keV, 2.0−12.0 keV), showing the complex background structure of the field (panel a), the MOS1 background map derived from a spline fit (panel b) and from adaptive smoothing (panel c), the source-excised image (panel e), its ratio to the two background maps (panels f and g) and the ratio between them (panel h). The source-excised image is smoothed with a Gaussian kernel of increasing width (panel i). All images have a linear intensity scale. The smoothed layers which are chosen per image pixel to construct the background map according to their S/N are shown in grey-scale (panel d).
Current usage metrics show cumulative count of Article Views (full-text article views including HTML views, PDF and ePub downloads, according to the available data) and Abstracts Views on Vision4Press platform.
Data correspond to usage on the plateform after 2015. The current usage metrics is available 48-96 hours after online publication and is updated daily on week days.
Initial download of the metrics may take a while.