Fig. A.1.
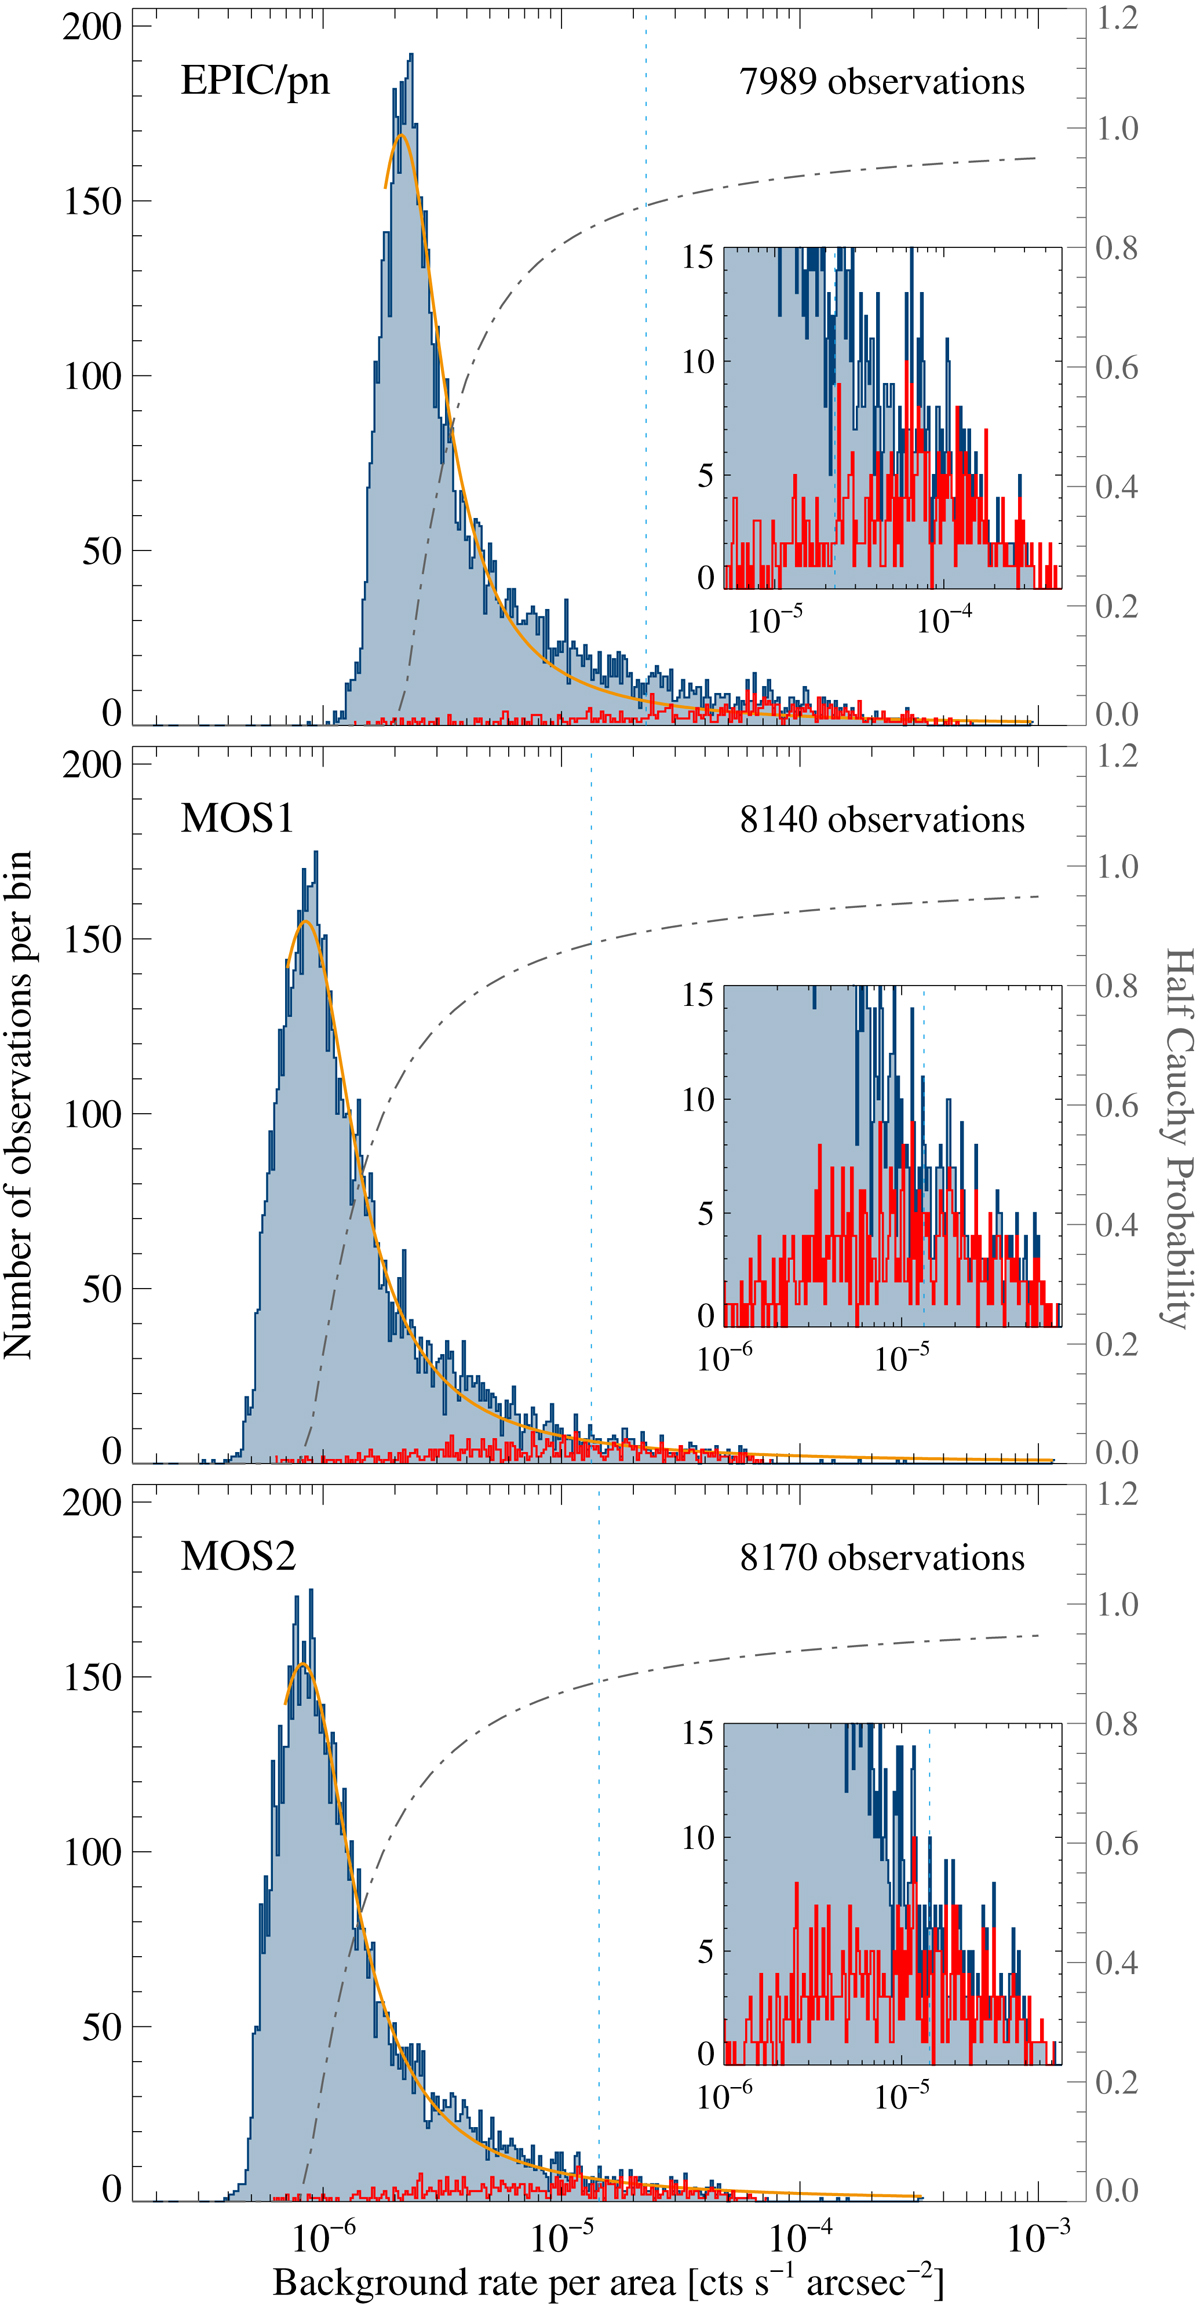
Histograms of the derived background rates per area of all considered observations of EPIC-pn, MOS1, and MOS2 (from top to bottom). The orange line shows the Lorentz fit to the histogram and the grey dash-dotted line the Half Cauchy probability distribution, with the scale given in the right axis. The dashed vertical line marks the 87% probability cut used to discard observations as high-background contaminated. The red histogram shows the distribution of observations that have a HIGH_BACKGROUND flag in 3XMM-DR7 for comparison. Insets: zoom to the highest background values.
Current usage metrics show cumulative count of Article Views (full-text article views including HTML views, PDF and ePub downloads, according to the available data) and Abstracts Views on Vision4Press platform.
Data correspond to usage on the plateform after 2015. The current usage metrics is available 48-96 hours after online publication and is updated daily on week days.
Initial download of the metrics may take a while.