Fig. 20.
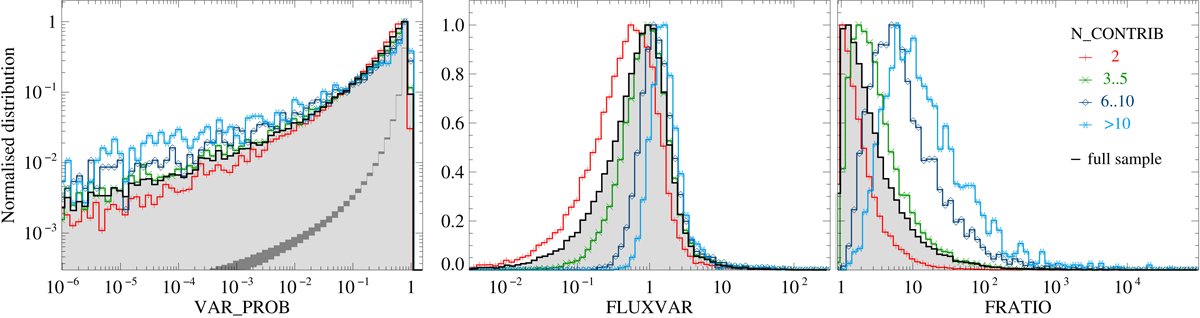
Three of the all-EPIC long-term variability parameters for point sources and their different dependence on the number of contributing observations. A low value of VAR_PROB and high values of FLUXVAR and FRATIO can indicate a long-term variable source. The dark grey area in the left panel indicates the 1σ range of the probability estimate for constant sources. All histograms are normalised to their maximum.
Current usage metrics show cumulative count of Article Views (full-text article views including HTML views, PDF and ePub downloads, according to the available data) and Abstracts Views on Vision4Press platform.
Data correspond to usage on the plateform after 2015. The current usage metrics is available 48-96 hours after online publication and is updated daily on week days.
Initial download of the metrics may take a while.