Fig. 2.
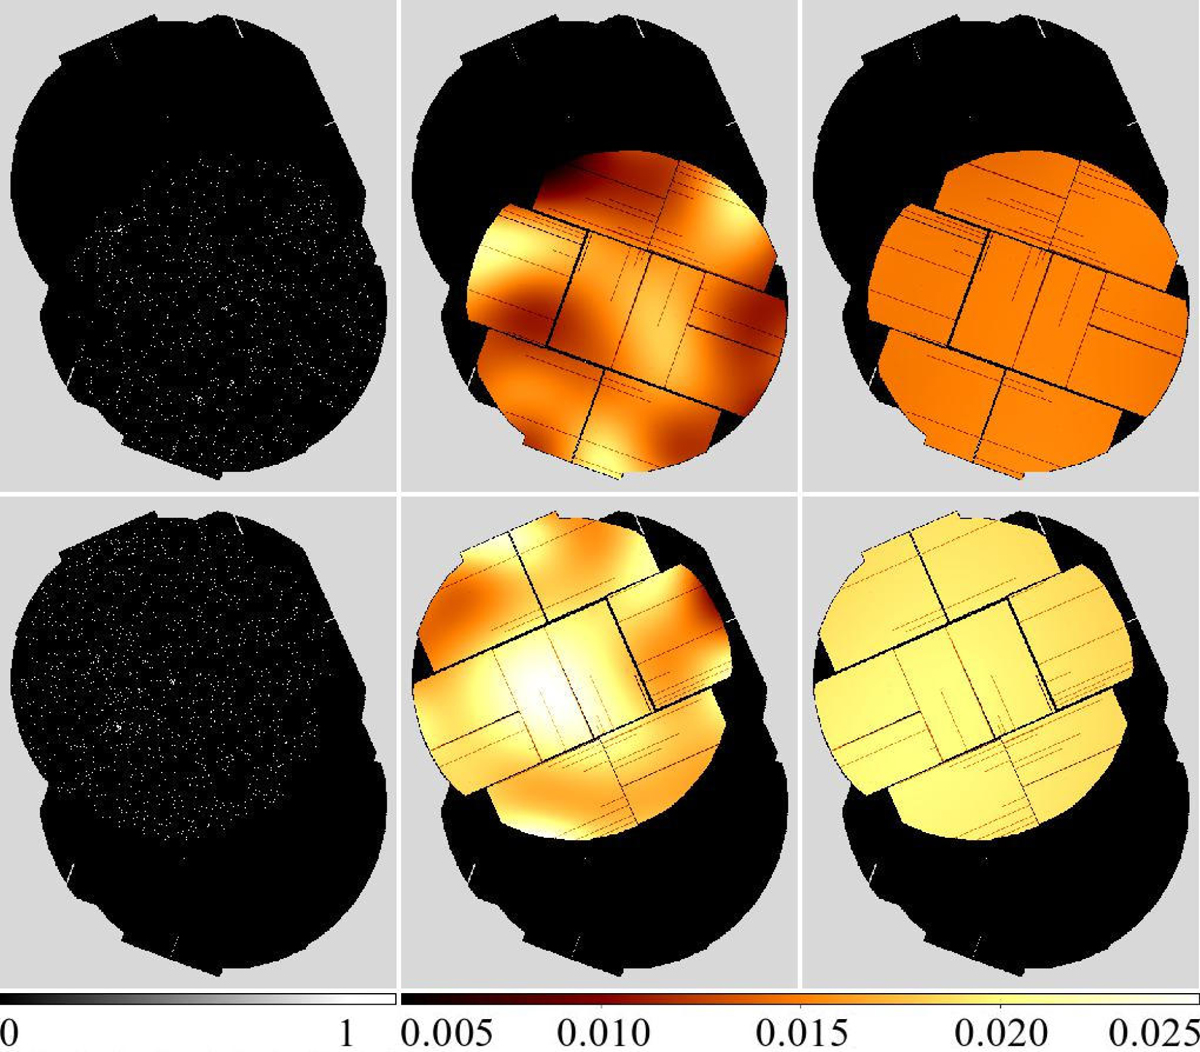
Example of low-amplitude brightness fluctuations in the background maps produced by spline fits: images (left), spline fits (middle), and adaptive smoothing (right) of MOS2 in the 2.0−4.5 keV band of a stack of two observations (identifiers 0741033401 and 0741033501). The sky region covered by all instruments is shown in black.
Current usage metrics show cumulative count of Article Views (full-text article views including HTML views, PDF and ePub downloads, according to the available data) and Abstracts Views on Vision4Press platform.
Data correspond to usage on the plateform after 2015. The current usage metrics is available 48-96 hours after online publication and is updated daily on week days.
Initial download of the metrics may take a while.