Fig. 18.
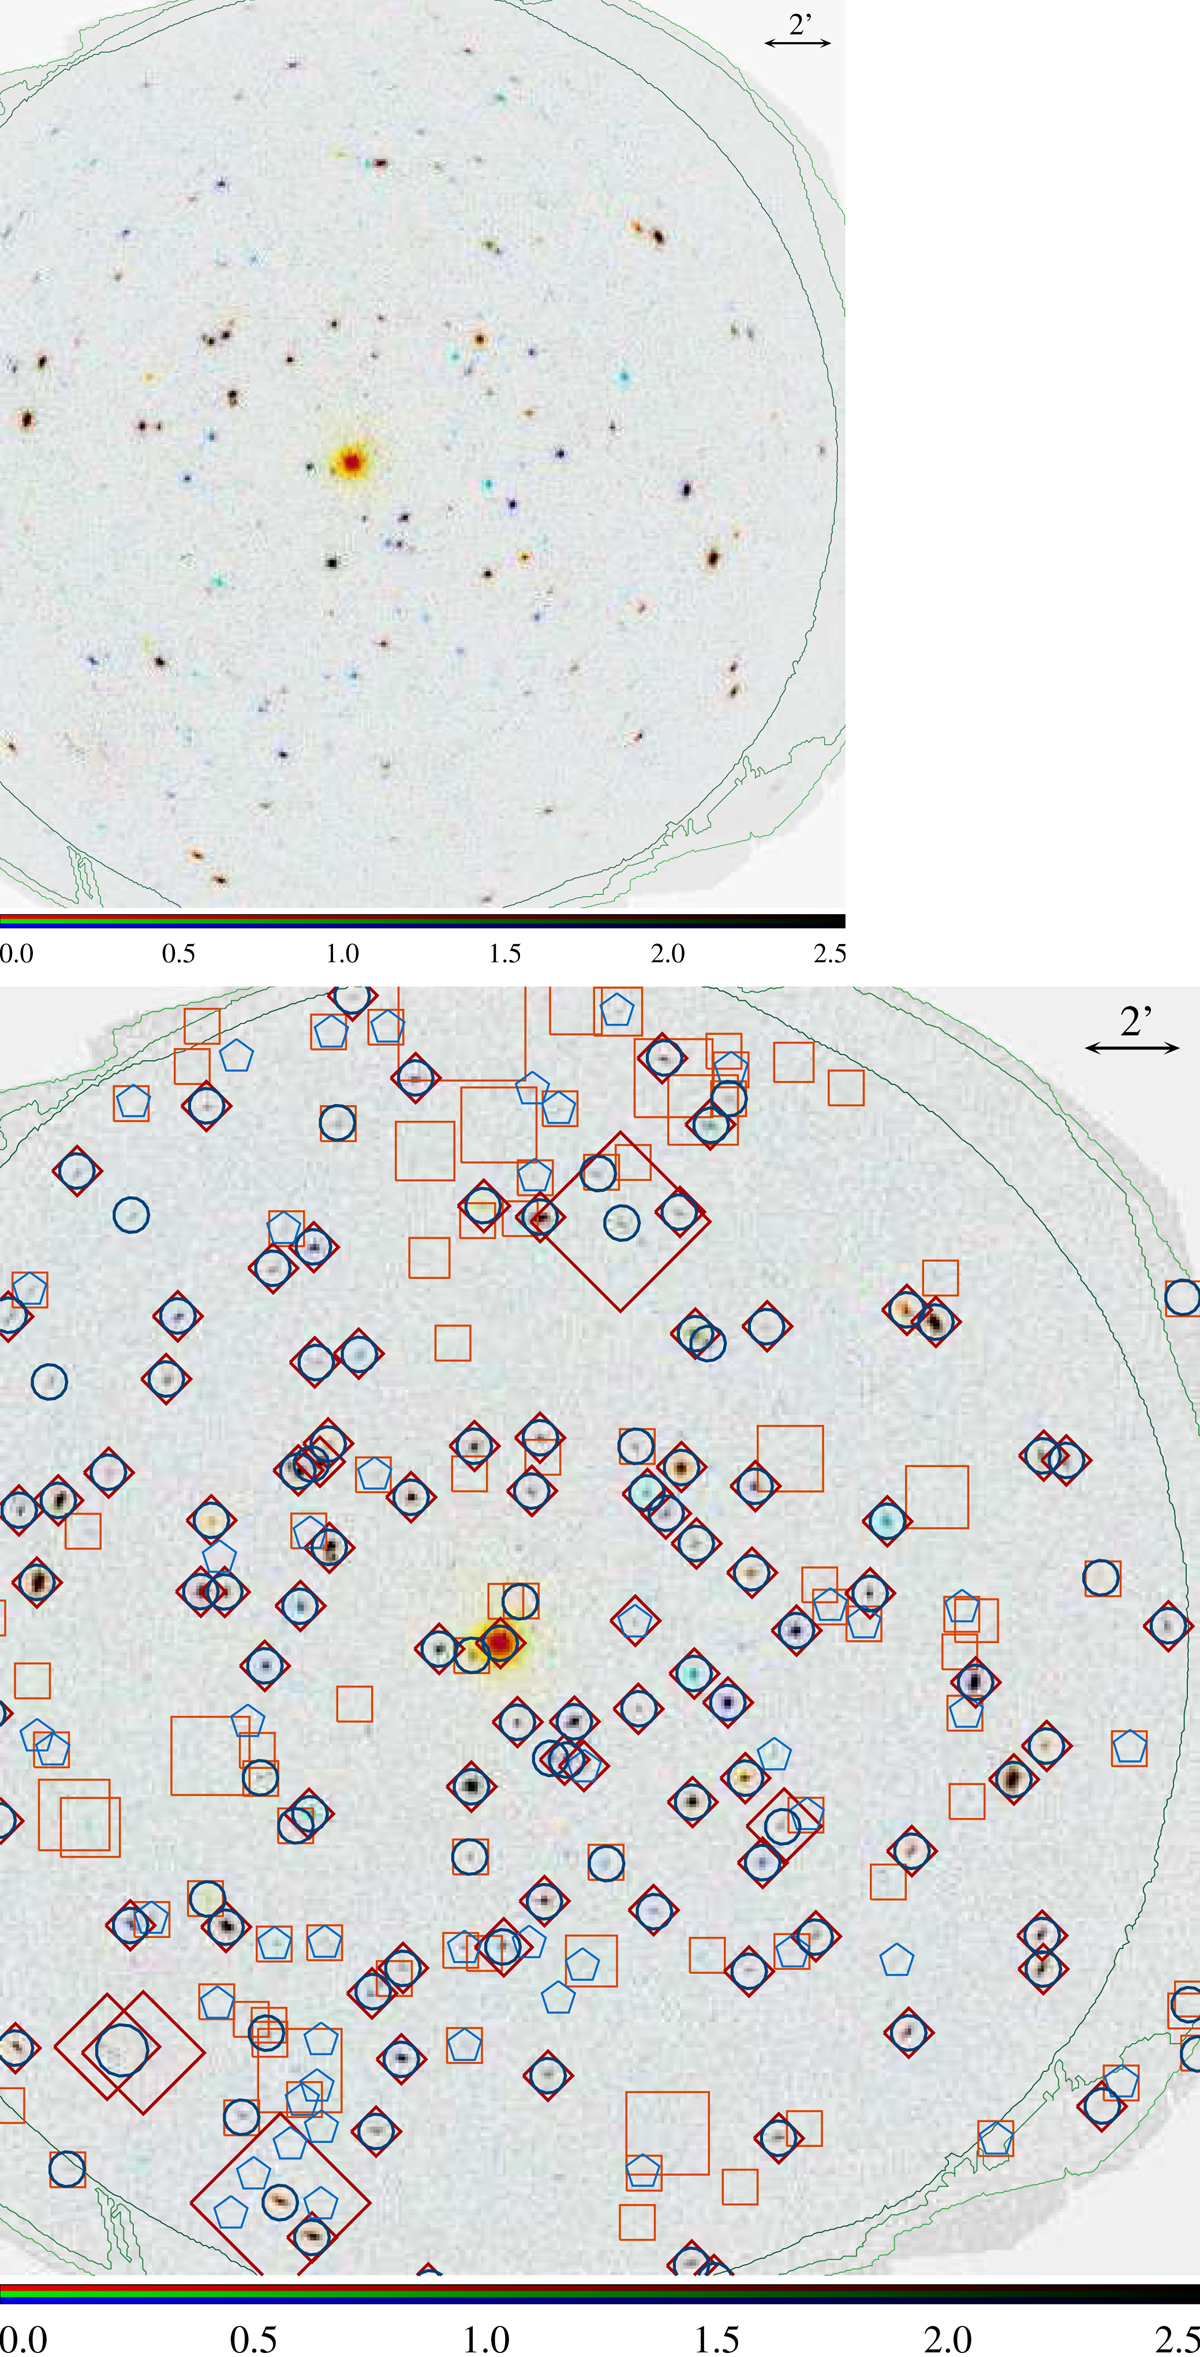
Example with large deviations between stacked and joint source list: nineteen observations of HD 81809. For clarity, the mosaicked image is shown both without and with source identifications. Blue symbols: sources detected in the stack. Thick circles are used for sources with an equivalent detection likelihood above six in total or in at least two observations, thin pentagons for the others. Red symbols: joined individual detections. Thick diamonds are used for those merged from more than two observations, thin squares for the others. The plot symbols have a minimum radius of 22″ and scale with the source extent if it is larger than that. The contours enclose areas within at least two (red), seven (orange), and twelve (white) observations overlap.
Current usage metrics show cumulative count of Article Views (full-text article views including HTML views, PDF and ePub downloads, according to the available data) and Abstracts Views on Vision4Press platform.
Data correspond to usage on the plateform after 2015. The current usage metrics is available 48-96 hours after online publication and is updated daily on week days.
Initial download of the metrics may take a while.