Fig. 12.
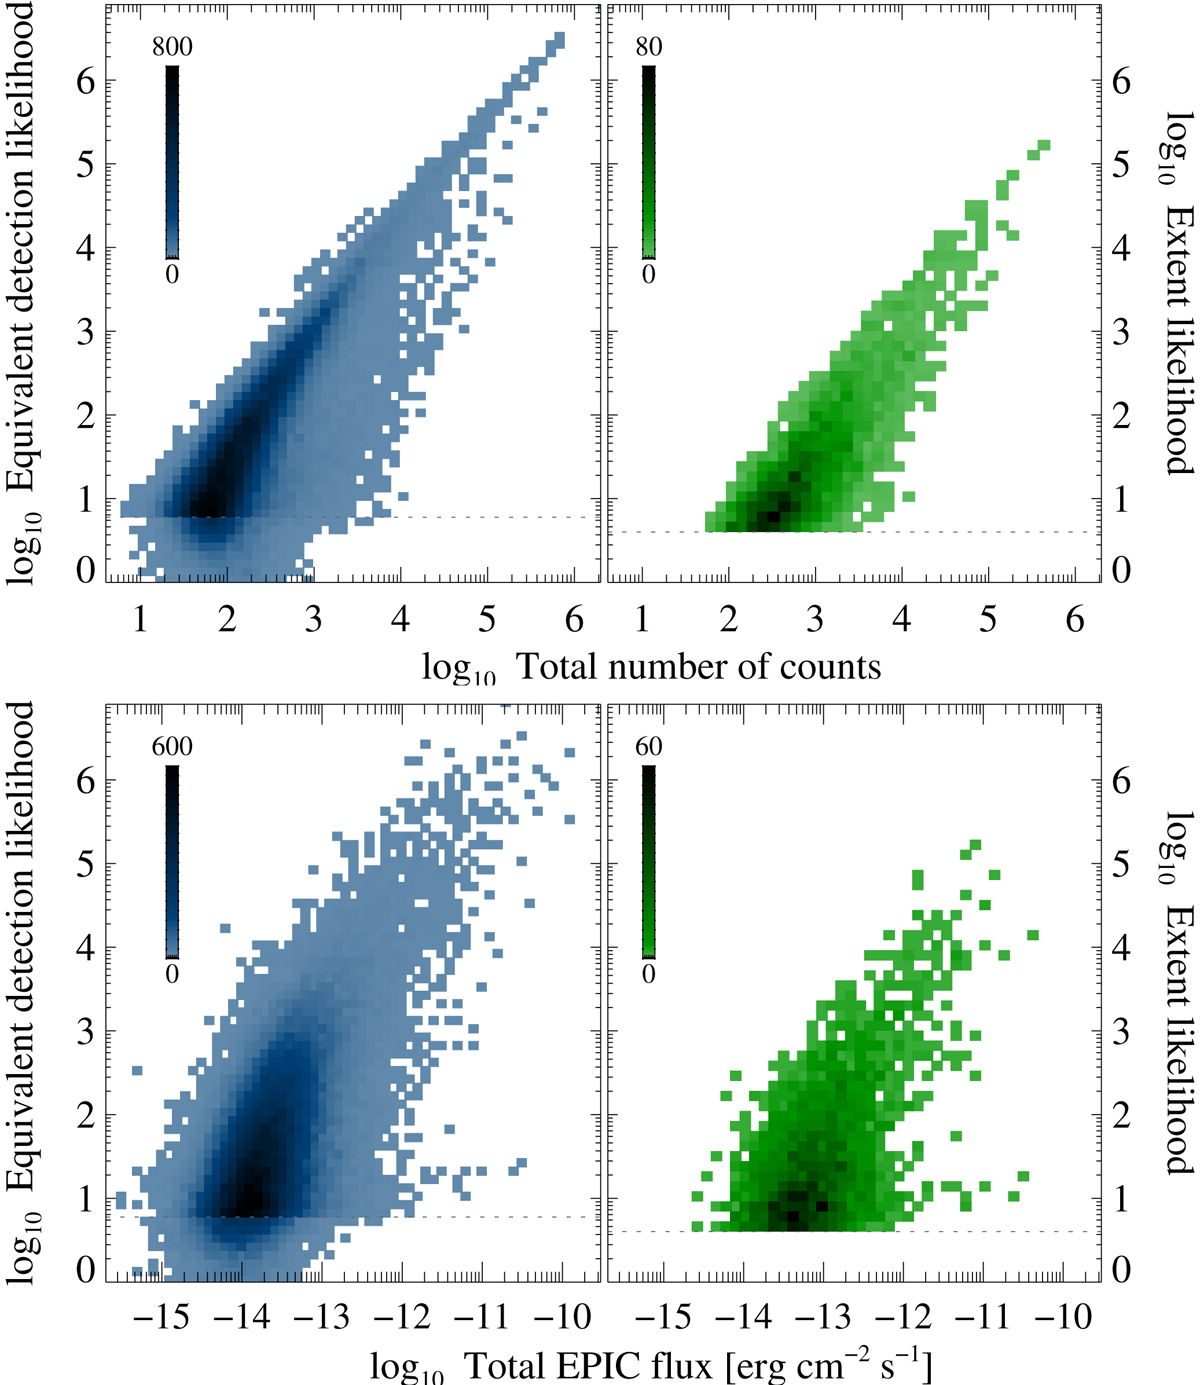
Relation of stacked detection and extent likelihoods to source flux and counts in 3XMM-DR7s. Dotted lines mark the lower limits: minimum detection likelihood to include a source in the source list and minimum extent likelihood per fit to consider a source extended. Colour density scales with the source number per plotting bin.
Current usage metrics show cumulative count of Article Views (full-text article views including HTML views, PDF and ePub downloads, according to the available data) and Abstracts Views on Vision4Press platform.
Data correspond to usage on the plateform after 2015. The current usage metrics is available 48-96 hours after online publication and is updated daily on week days.
Initial download of the metrics may take a while.