Free Access
Fig. 11.
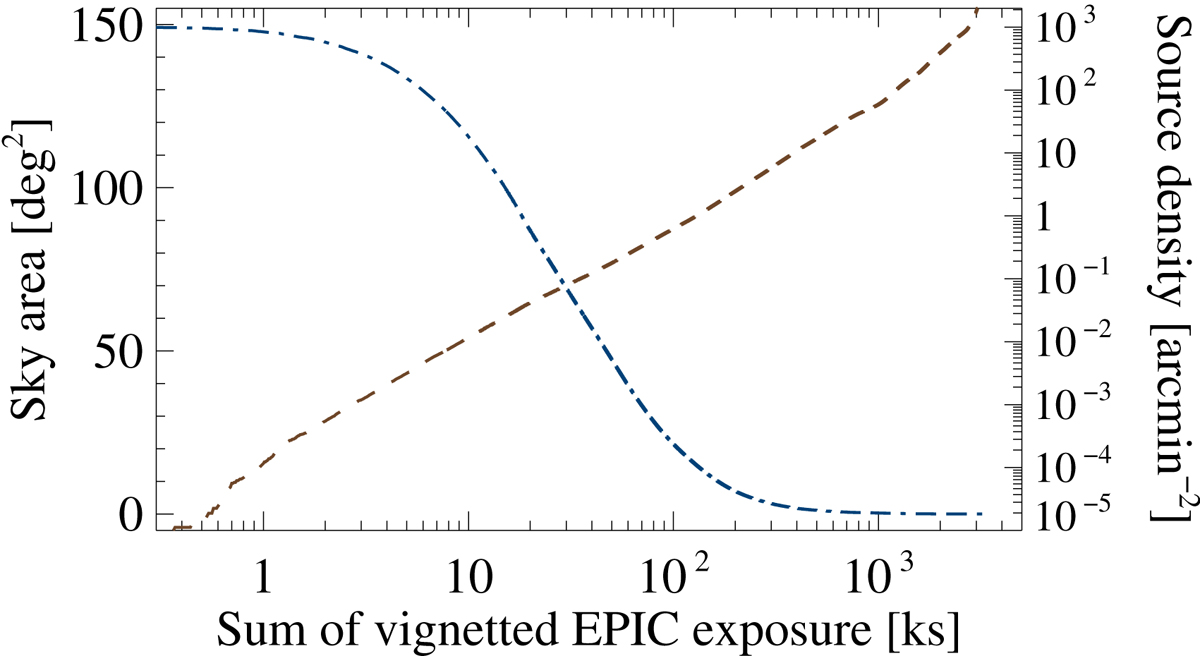
Sky area (blue dash-dotted) and source density (brown dashed) as an approximate measure of detection sensitivity over the total EPIC exposure times of the catalogue stacks. The plot shows the vignetted exposure time averaged over the five energy bands and summed for the three EPIC instruments pn, MOS1, and MOS2.
Current usage metrics show cumulative count of Article Views (full-text article views including HTML views, PDF and ePub downloads, according to the available data) and Abstracts Views on Vision4Press platform.
Data correspond to usage on the plateform after 2015. The current usage metrics is available 48-96 hours after online publication and is updated daily on week days.
Initial download of the metrics may take a while.