Fig. 1.
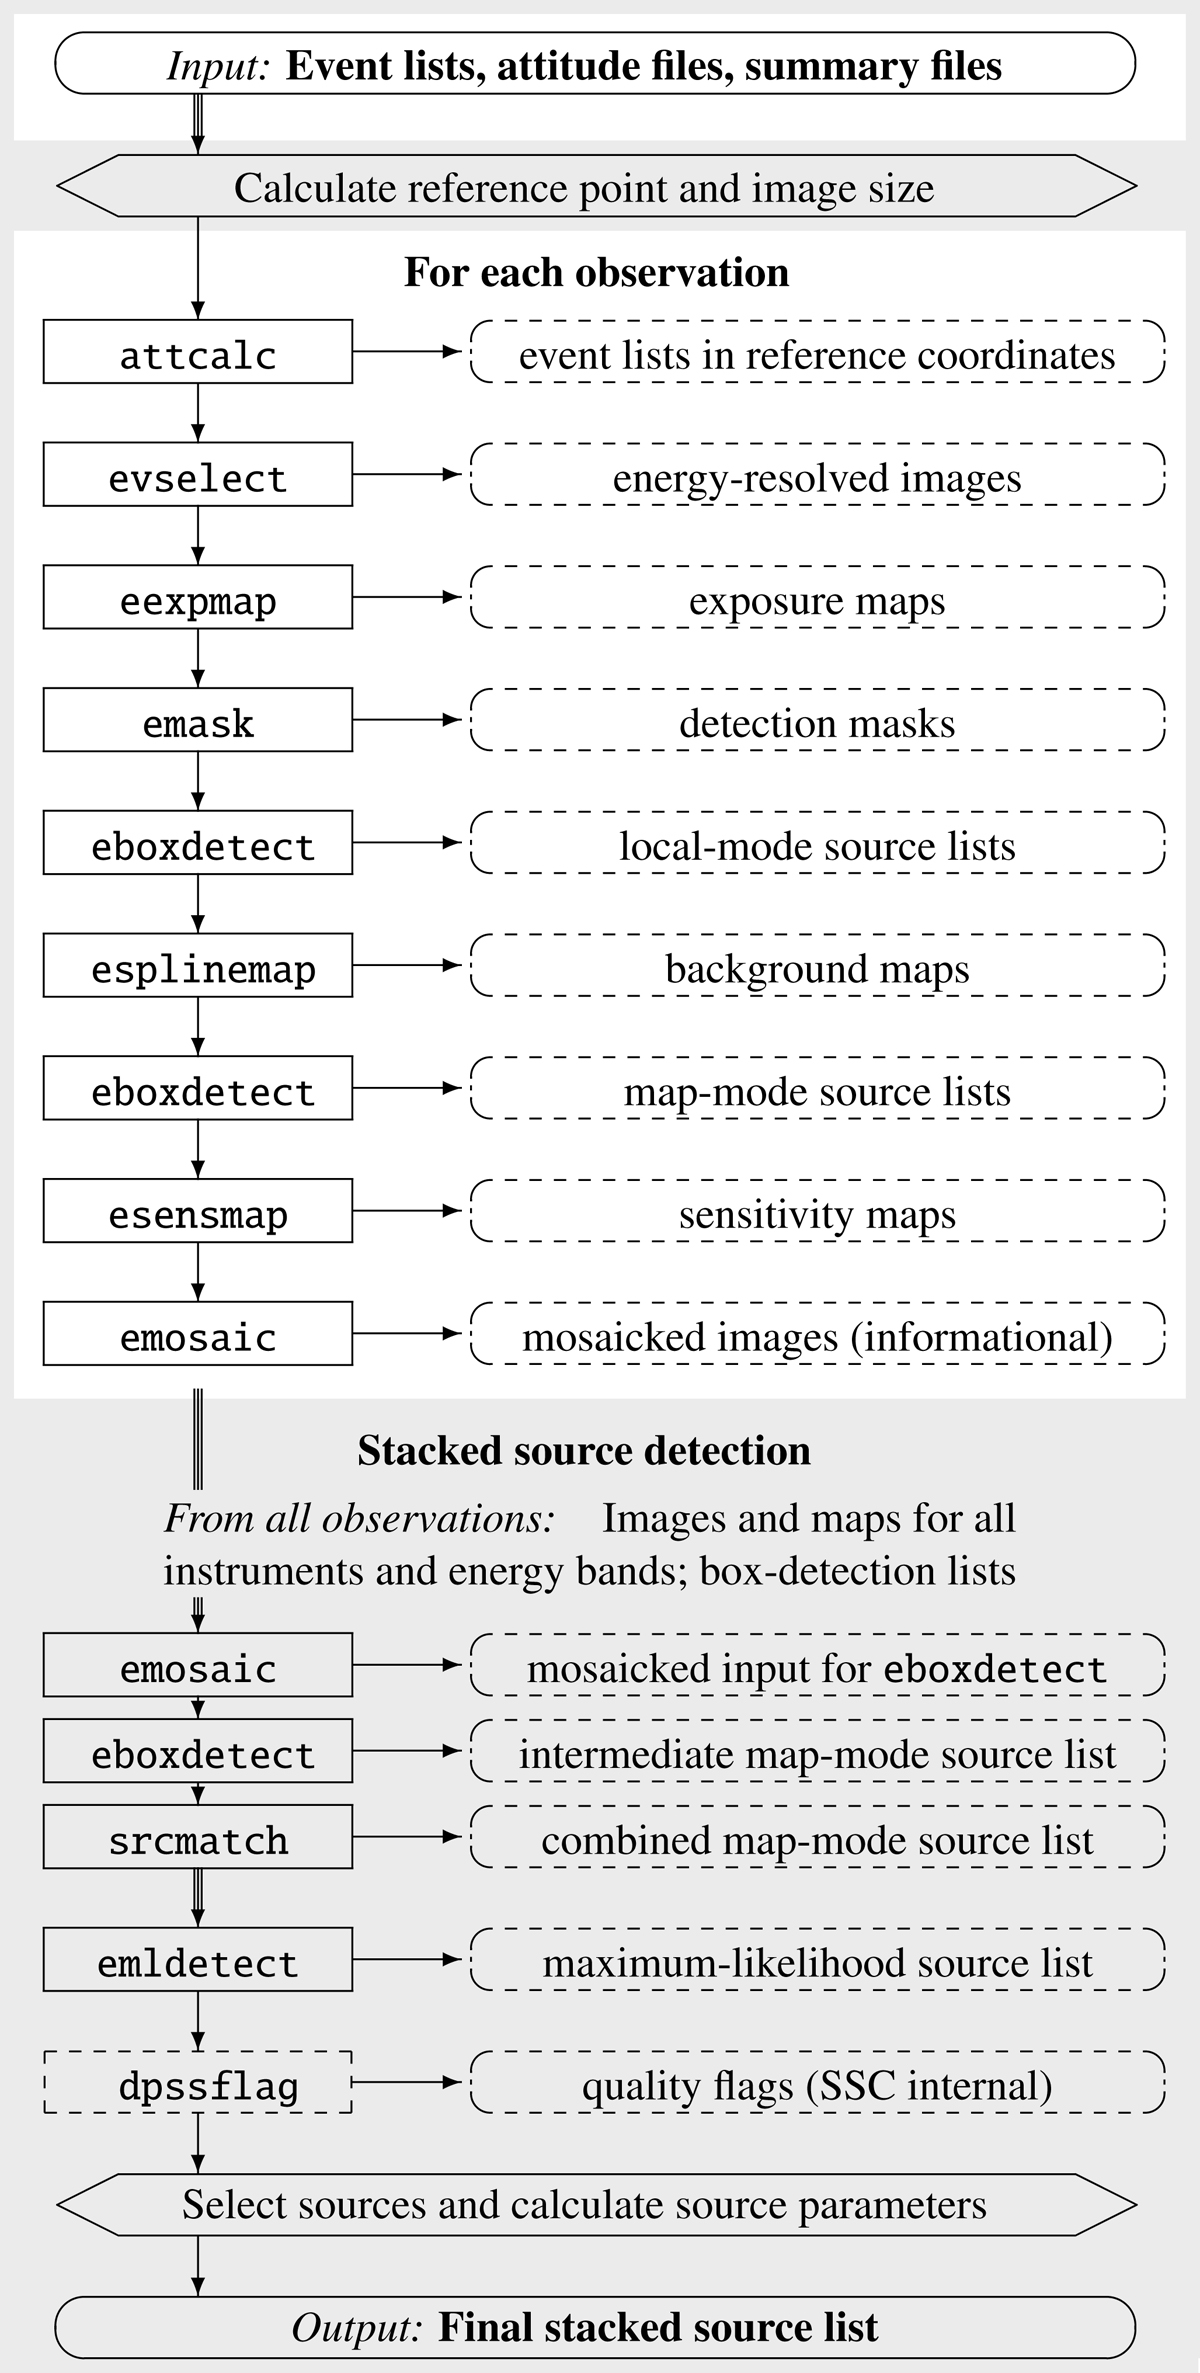
Structure of the task edetect_stack. Internal steps are shown in hexagonal boxes, calls to external SAS tasks in rectangles, and their data products in dashed rounded boxes. Stages dealing with all observations simultaneously are highlighted by a grey background. In “local mode”, eboxdetect uses an internally determined local background value, while in “map mode” an external background map is applied. This is produced by esplinemap, which is named after its first functionality and now run in its new adaptive-smoothing mode (Sect. 2.2).
Current usage metrics show cumulative count of Article Views (full-text article views including HTML views, PDF and ePub downloads, according to the available data) and Abstracts Views on Vision4Press platform.
Data correspond to usage on the plateform after 2015. The current usage metrics is available 48-96 hours after online publication and is updated daily on week days.
Initial download of the metrics may take a while.