Fig. 9.
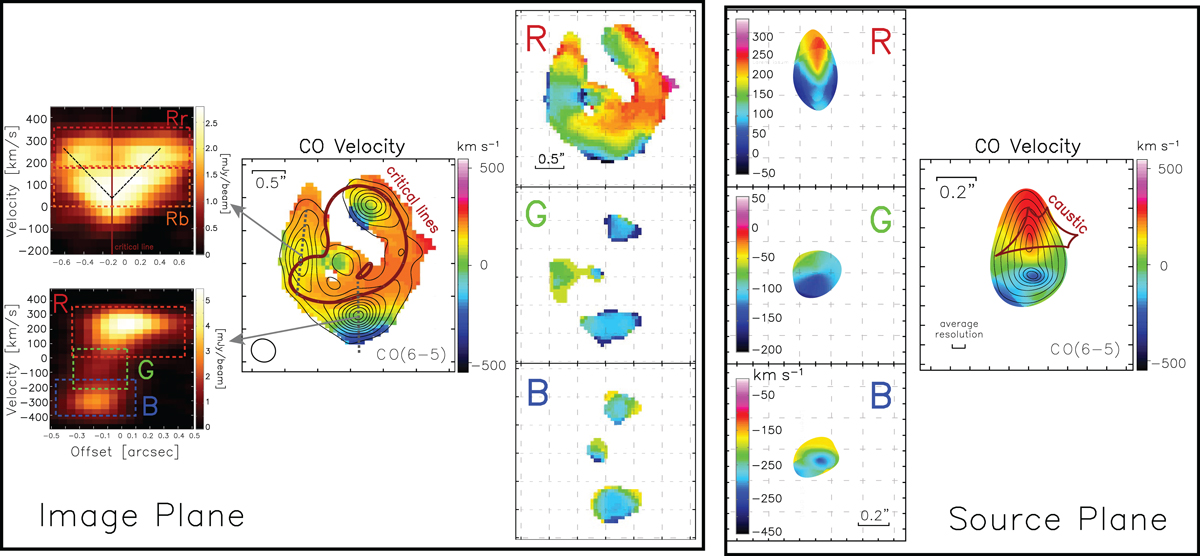
Left panels, in the image plane: PV plots in the image plane CO(6–5) data cube along the direction marked by the gray dashed lines are shown in the first column. The dark red line shows the position of the critical line. The dashed squares show the major velocity components “R” (Rb+Rr), “G”, and “B”. The second column shows the 0th & 1st moment map of CO(6–5) similar to Fig. 2. The critical line is marked by dark red line. The third column shows the slice of 1st moment CO maps according to the R, G, and B velocity ranges marked in the lower panel of the PV plot in the first column. Right panels, in the source plane: the first column shows the slice of 1st CO moment maps for R, G, and B. The second column shows a similar image of 0th & 1st moment maps of CO(6–5) in the image plane with the caustic line (dark red line) overlaid. By comparing the velocity structures of R, G, and B both in the image plane and the source plane, and also the PV plot, it is clear that the source has three major velocity structures: the approaching gas B, the bridging gas G and the receding gas component R that has a velocity-resolved structure showing a velocity gradient along the north-south direction.
Current usage metrics show cumulative count of Article Views (full-text article views including HTML views, PDF and ePub downloads, according to the available data) and Abstracts Views on Vision4Press platform.
Data correspond to usage on the plateform after 2015. The current usage metrics is available 48-96 hours after online publication and is updated daily on week days.
Initial download of the metrics may take a while.