Fig. 8.
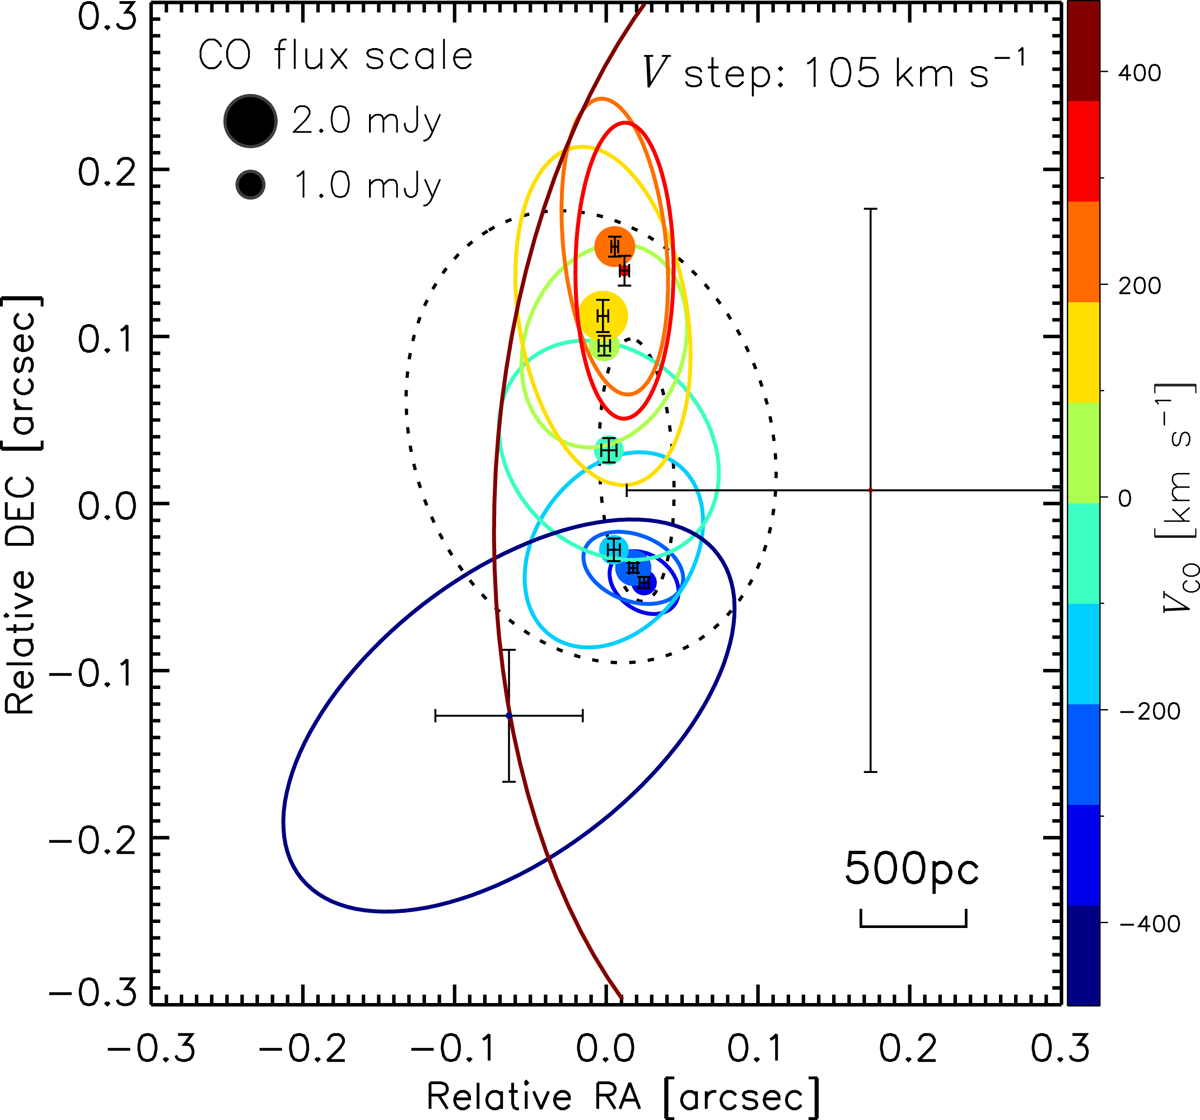
Ellipses showing the disk model for the CO(6–5) line emission per velocity channel bin (the central velocity of each disk is indicated by its color as indicated in the color bar). The parameters used to draw each ellipse in the diagram, i.e., half-light radius, PA, and ellipticity, are their median values. The points with error bars indicate the central positions and their uncertainties for each disk. The sizes and positions of the filled circles indicate the total flux and the center of the disk at each velocity bin (the flux scales are shown in the legend in the top left corner and the velocities are given by the color bar). The velocity bins are in steps of 105 km s−1 (see text). The figure shows clearly a concentration of fluxes with approaching velocities at radii smaller than ![]() (0.4 kpc), while the fluxes associated with the receding velocities show a significant gradual change in position and a larger overall radius of
(0.4 kpc), while the fluxes associated with the receding velocities show a significant gradual change in position and a larger overall radius of ![]() (1.2 kpc).
(1.2 kpc).
Current usage metrics show cumulative count of Article Views (full-text article views including HTML views, PDF and ePub downloads, according to the available data) and Abstracts Views on Vision4Press platform.
Data correspond to usage on the plateform after 2015. The current usage metrics is available 48-96 hours after online publication and is updated daily on week days.
Initial download of the metrics may take a while.