Fig. 7.
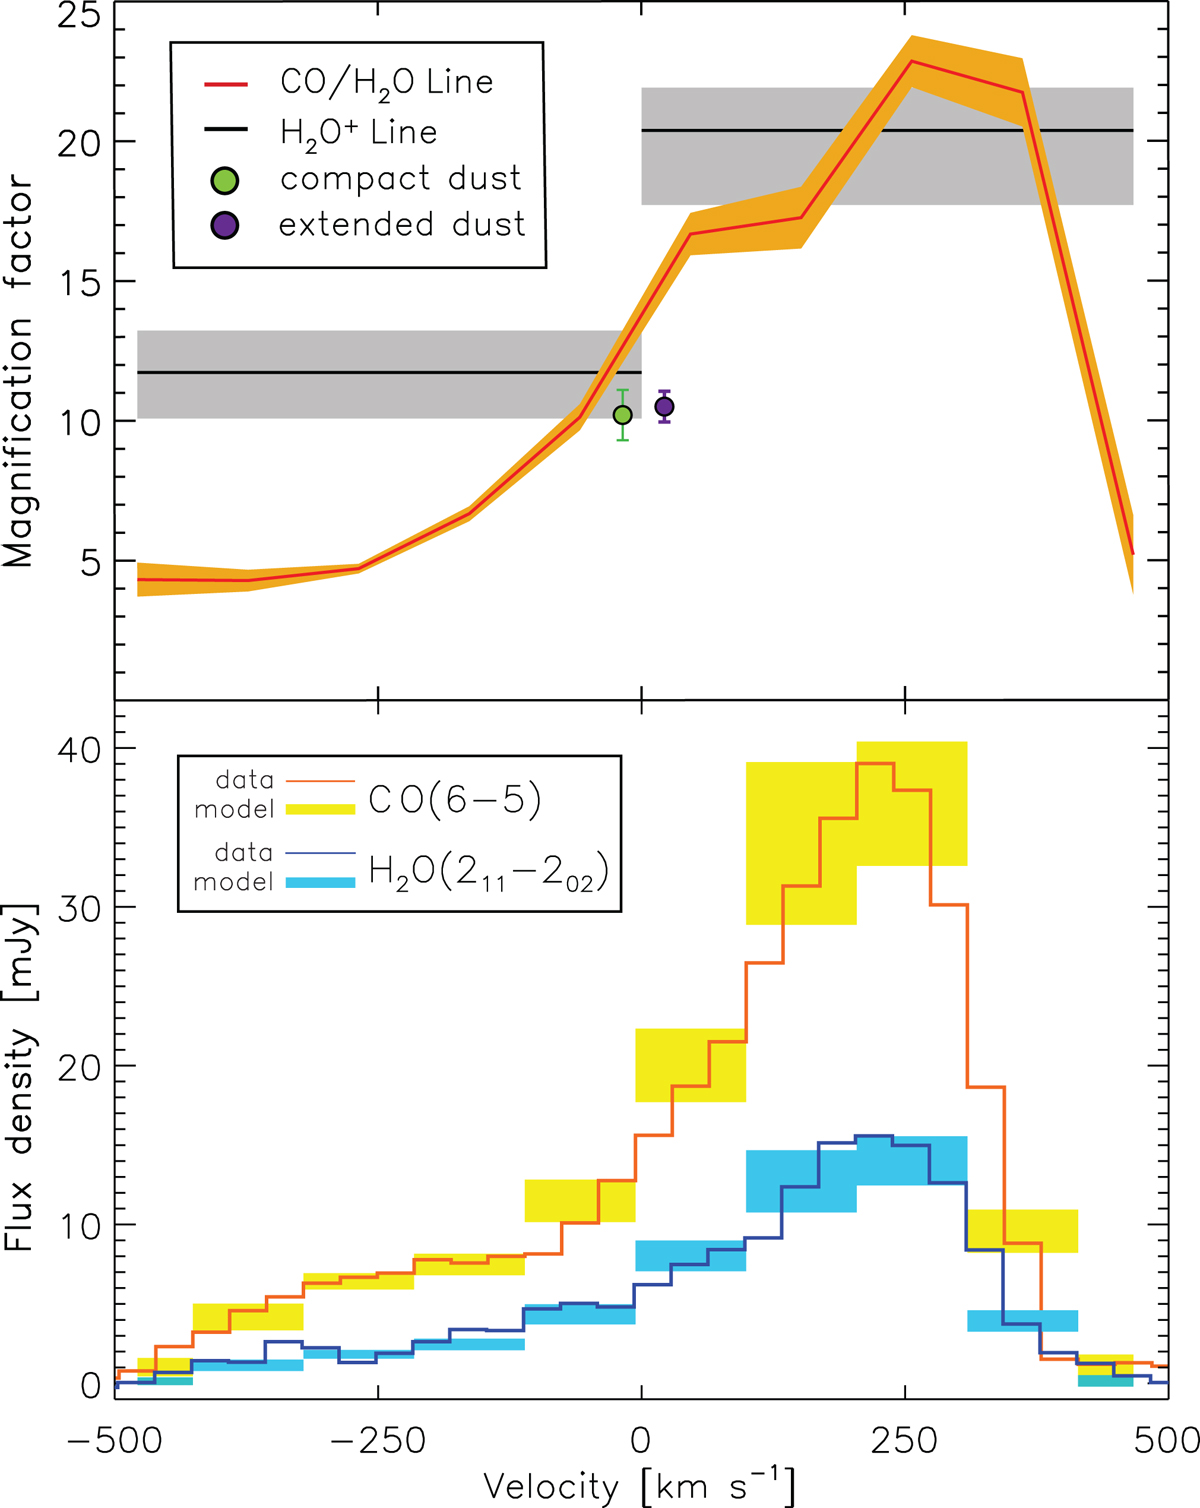
Top panel: magnification factor as a function of velocity for the emission lines of CO, H2O, and H2O+, and indicated for the two dust components (the legend at the top left corner indicates the line and point style for each component of emission). Bottom panel: a comparison between the integrated spectrum of the observations and lens-model reconstructed data seen in the image plane. The filled regions show the model reconstructed using the bins in the image-plane spectra, while the histogram lines show the observed image-plane spectra (see the legend at the top left). The model overall predicts very well the spectra in the source plane.
Current usage metrics show cumulative count of Article Views (full-text article views including HTML views, PDF and ePub downloads, according to the available data) and Abstracts Views on Vision4Press platform.
Data correspond to usage on the plateform after 2015. The current usage metrics is available 48-96 hours after online publication and is updated daily on week days.
Initial download of the metrics may take a while.