Fig. 6.
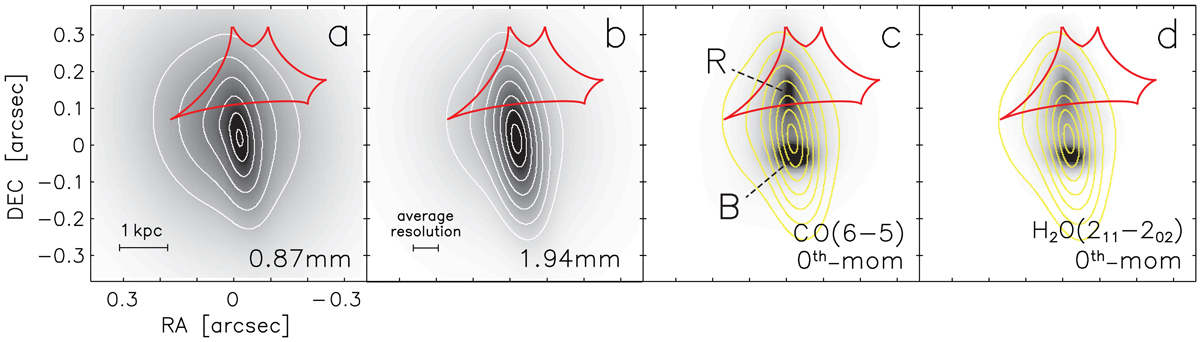
Reconstructed images of the dust continuum and line emission of G09v1.97 using the lens model, displaying: (panels a and b) the images and contours showing the source-plane 0.87 and 1.94 mm dust continuum emission, and (panels c and d) the velocity-integrated CO(6–5) and H2O(211−202) line emission with yellow contours of the 1.94 mm dust emission overlaid for comparison. The central coordinates are the same as in Fig. 5. The caustic lines are shown in red. The flux ratio of the two dust continuum disk components at 0.87 and 1.94 mm are different, indicating that the two components have either different dust temperatures and/or different submm optical depths. The average resolution indicated in panel b is derived from ![]() (0.4 kpc). The gas emission traced by CO(6–5) and H2O(211−202) is configured in two distinct components separated by 1.3 kpc in projection. The R component is associated with the red-shifted velocity bins of the line spectra, namely Rr and Rb of the line profile, while the B component corresponds to the blue-shifted part of the line profile as shown in Fig. 4. The dust continuum (rest-frame 188 and 419 μm) peaks between the two gas components and a bit towards the south. The gas emission is more extended than the dust continuum (comparing the half-light radii, see Sect. 5.1 for details) consistent with the analysis of the image plane.
(0.4 kpc). The gas emission traced by CO(6–5) and H2O(211−202) is configured in two distinct components separated by 1.3 kpc in projection. The R component is associated with the red-shifted velocity bins of the line spectra, namely Rr and Rb of the line profile, while the B component corresponds to the blue-shifted part of the line profile as shown in Fig. 4. The dust continuum (rest-frame 188 and 419 μm) peaks between the two gas components and a bit towards the south. The gas emission is more extended than the dust continuum (comparing the half-light radii, see Sect. 5.1 for details) consistent with the analysis of the image plane.
Current usage metrics show cumulative count of Article Views (full-text article views including HTML views, PDF and ePub downloads, according to the available data) and Abstracts Views on Vision4Press platform.
Data correspond to usage on the plateform after 2015. The current usage metrics is available 48-96 hours after online publication and is updated daily on week days.
Initial download of the metrics may take a while.