Fig. 5.
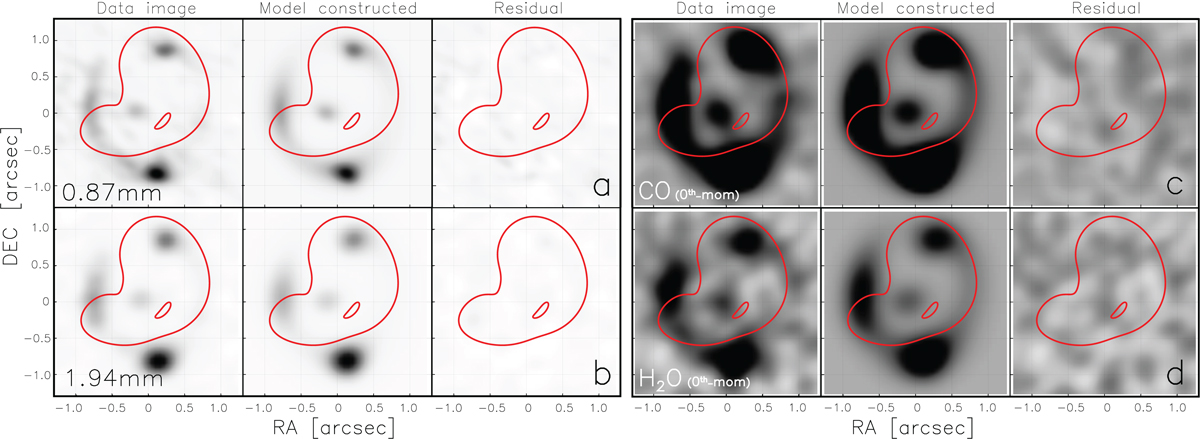
Panels a–c: image-plane lens modeling results of the 1.94 and 0.87 mm dust continuum, CO(6–5) and H2O(211−202) line emission for G09v1.97. The panels are grouped in horizontal sets of three sub-panels each showing, from left to right: i) observed image; ii) reconstructed image from the lens model; and iii) residuals from the difference between observed and model images. The red lines represent the critical curves. The central coordinates are given in Table 3. The figure clearly demonstrates that the lens model can recover the fluxes of the dust continuum and line emission accurately. The corresponding source-plane images are show in Fig. 6. All the residuals are well within ±2.5σ, showing that all the modeled images of the dust continuum and the emission lines agree very well with the overall flux distribution.
Current usage metrics show cumulative count of Article Views (full-text article views including HTML views, PDF and ePub downloads, according to the available data) and Abstracts Views on Vision4Press platform.
Data correspond to usage on the plateform after 2015. The current usage metrics is available 48-96 hours after online publication and is updated daily on week days.
Initial download of the metrics may take a while.