Fig. 3.
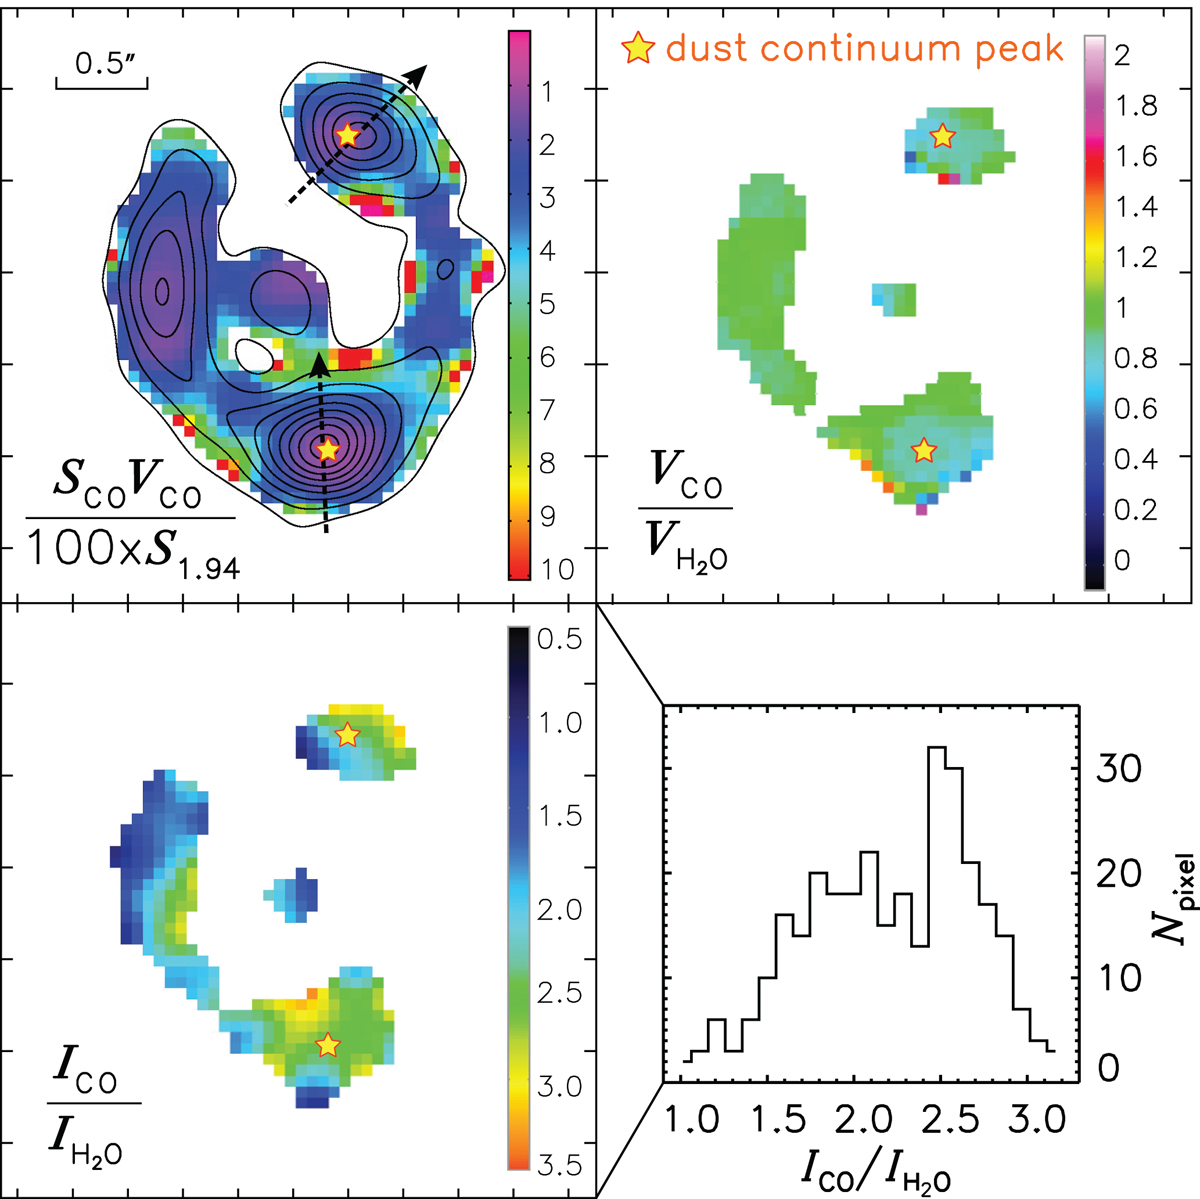
Top left: ratio of the 0th moment of CO(6–5) to the rest-frame 419 μm (observed wavelength of 1.94 mm) continuum. The contours are for the CO(6–5) 0th moment and are the same as in Fig. 2. Top right: 1st moment ratio map of CO(6–5) to H2O(211−202). Bottom left: 0th moment ratio map of CO(6–5) to H2O(211−202). Bottom right: histogram of the CO(6–5)-to-H2O(211−202) 0th moment ratio. The positions of the dust peak at north and south are indicated with yellow stars. The figure shows that the CO(6–5) emission is more extended than the dust continuum emission. Despite the small variation of the 0th moment ratio, CO(6–5) and H2O(211−202) show very similar velocity structure.
Current usage metrics show cumulative count of Article Views (full-text article views including HTML views, PDF and ePub downloads, according to the available data) and Abstracts Views on Vision4Press platform.
Data correspond to usage on the plateform after 2015. The current usage metrics is available 48-96 hours after online publication and is updated daily on week days.
Initial download of the metrics may take a while.