Fig. 2.
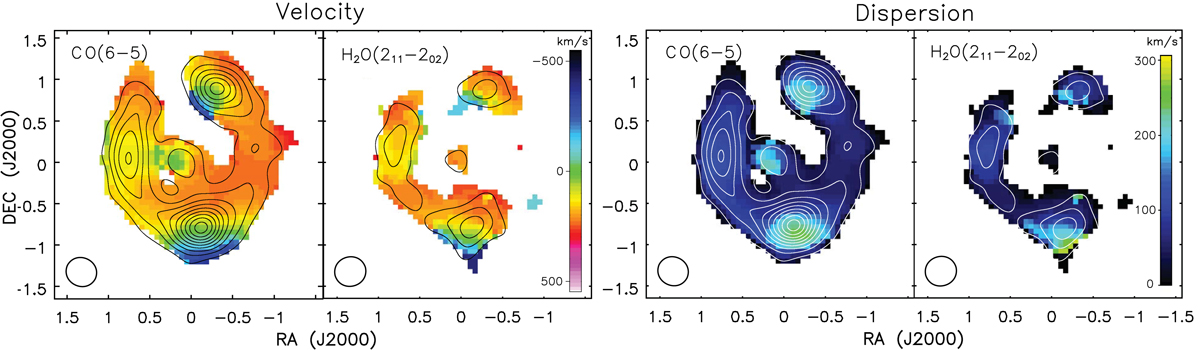
1st moment (velocity, left two panels) and 2nd moment (velocity dispersion, right two panels) color maps of the CO(6–5) and H2O(211−202) line emission overlaid by the 0th moment (velocity-integrated line emission) contours. The images reveal the strongly lensed kinematic structure of G09v1.97 in the image plane in both CO(6–5) and H2O(211−202), with a significant velocity gradient seen in the northeastern and southern components. The CO and H2O lines trace similar kinematic structure as shown by the close correspondence between their first and second moment maps.
Current usage metrics show cumulative count of Article Views (full-text article views including HTML views, PDF and ePub downloads, according to the available data) and Abstracts Views on Vision4Press platform.
Data correspond to usage on the plateform after 2015. The current usage metrics is available 48-96 hours after online publication and is updated daily on week days.
Initial download of the metrics may take a while.