Fig. A.3.
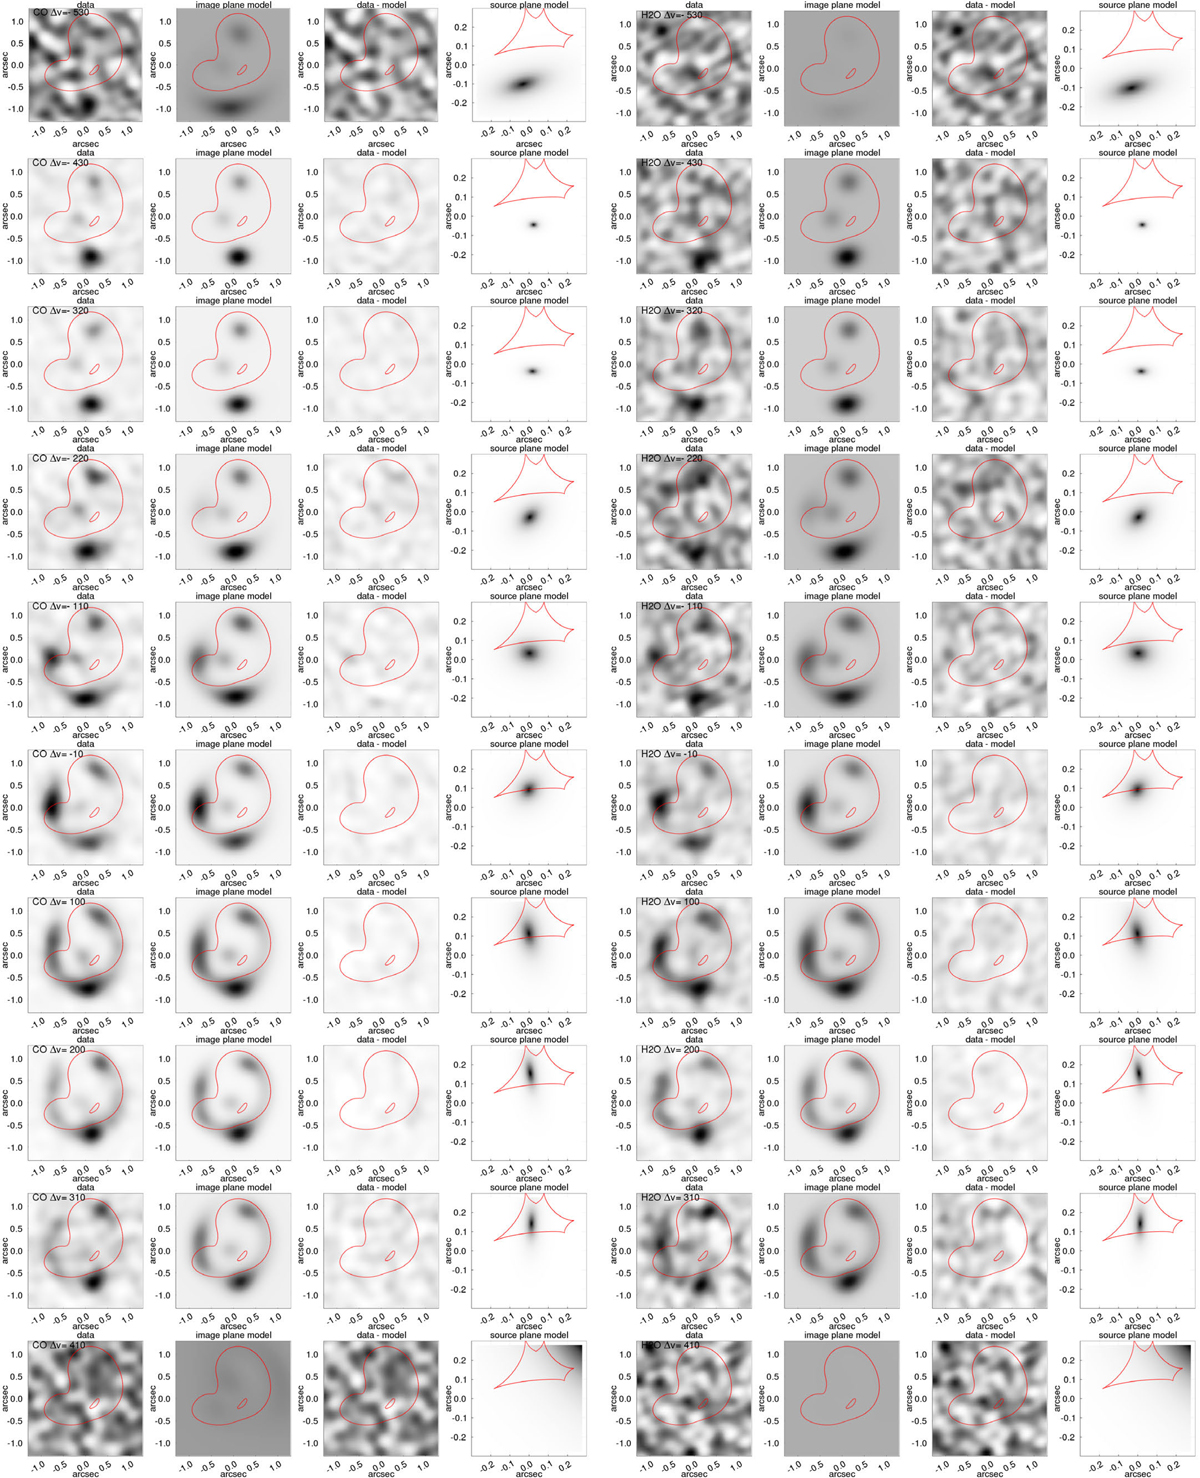
Coarse-grained channel-by-channel comparison of the reconstruction of line emissions. The content of each sub-panel is like in Fig. 5. From left to right: observed data (image plane), model-predicted image plane reconstruction, difference of these images, and right, model-predicted source plane reconstruction, successively for the CO(6–5) and H2O(211−202) lines. Sub-panels in Cols. 1,2,3,5,6,7 exhibit critical lines whereas the ones in Cols. 4,8 show caustic lines. From top to bottom: line emission channels are ordered with decreasing radial velocity, starting from −530 km s−1 (the beginning velocity of each bin), in steps of 105 km s−1. Throughout those channel maps, no residual above the ±3σ limit are found.
Current usage metrics show cumulative count of Article Views (full-text article views including HTML views, PDF and ePub downloads, according to the available data) and Abstracts Views on Vision4Press platform.
Data correspond to usage on the plateform after 2015. The current usage metrics is available 48-96 hours after online publication and is updated daily on week days.
Initial download of the metrics may take a while.