Fig. 12.
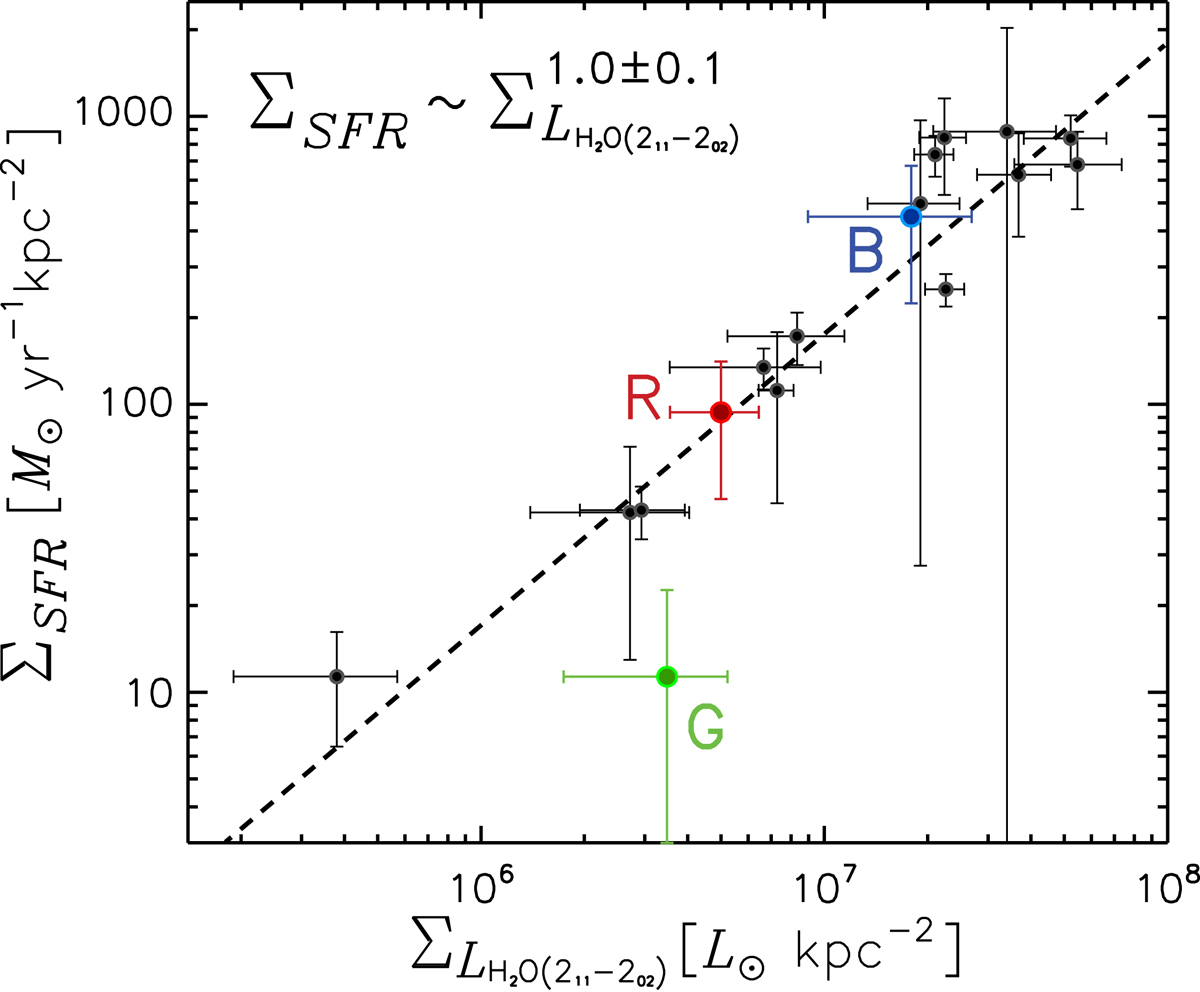
Correlation between the star formation rate (SFR) surface density and H2O luminosity surface density in high-redshift SMGs (Yang et al. 2016) (shown in black), including HFLS3 (Riechers et al. 2013) and ADFS-27 (Riechers et al. 2017). The red, blue and green data points represent the R, B, and G components of G09v1.97 from this work. The figure shows a tight linear correlation between ΣSFR and ΣLH2O with a fitted slope of 1.0 ± 0.2, which is valid down to the sub-kpc scales.
Current usage metrics show cumulative count of Article Views (full-text article views including HTML views, PDF and ePub downloads, according to the available data) and Abstracts Views on Vision4Press platform.
Data correspond to usage on the plateform after 2015. The current usage metrics is available 48-96 hours after online publication and is updated daily on week days.
Initial download of the metrics may take a while.