Fig. 11.
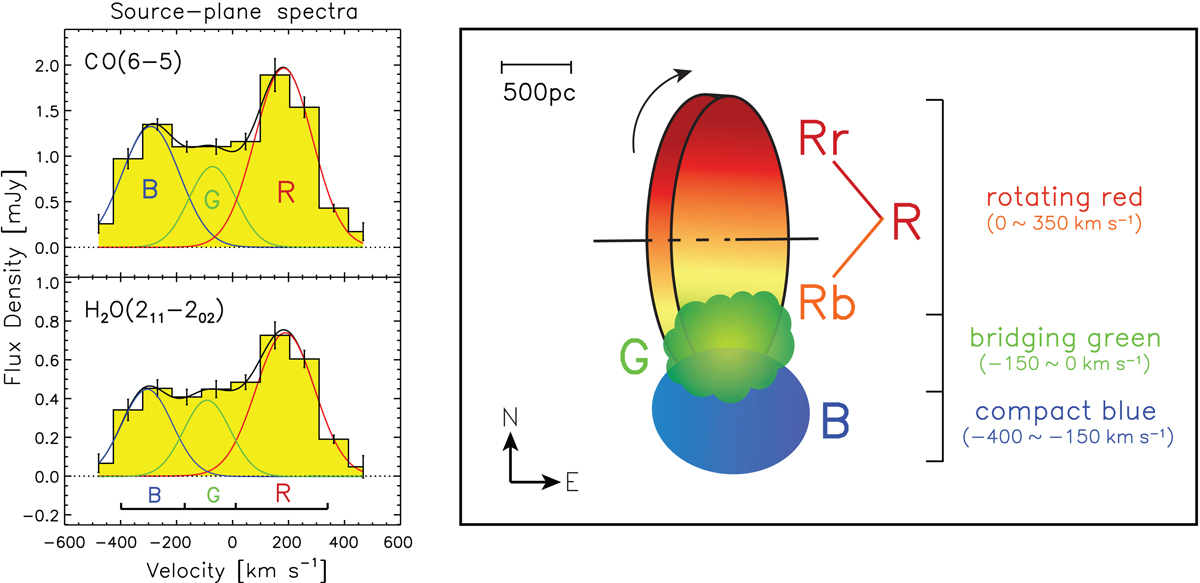
Left panel: spatially integrated spectra extracted from the source-plane line data-cubes constructed from the lens model. The error bars are dominated by the uncertainties in the data. The black curve shows the results of fitting 3 Gaussian line profiles: the blue line represents the B component, the green line represents the gas bridge G component, and the red line represents the receding gas R component (Rb+Rr). The line profiles of CO(6–5) and H2O(211−202) are similar, having ∼1.7 times stronger (peak flux) red-shifted emission compared to the blue-shifted emission. This indicates that there is a similar spatial distribution between the CO(6–5) and H2O(211−202) line emission. The asymmetry of the profile suggests an intrinsically complex velocity structure. Right panel: a sketch of the gas-rich major merger, G09v1.97. The source is composite of three major components, a rotating disk to the north that corresponds to the R component of the spectra shown in the left panel or the double-Gaussian component Rb+Rr seen in the image-plane spectrum, while the compact blue galaxy in the south corresponds to B part of the line profile. There is also a dust-rich gas bridge between the two over the component which has weak CO(6–5) and H2O(211−202) emission.
Current usage metrics show cumulative count of Article Views (full-text article views including HTML views, PDF and ePub downloads, according to the available data) and Abstracts Views on Vision4Press platform.
Data correspond to usage on the plateform after 2015. The current usage metrics is available 48-96 hours after online publication and is updated daily on week days.
Initial download of the metrics may take a while.