Fig. 1.
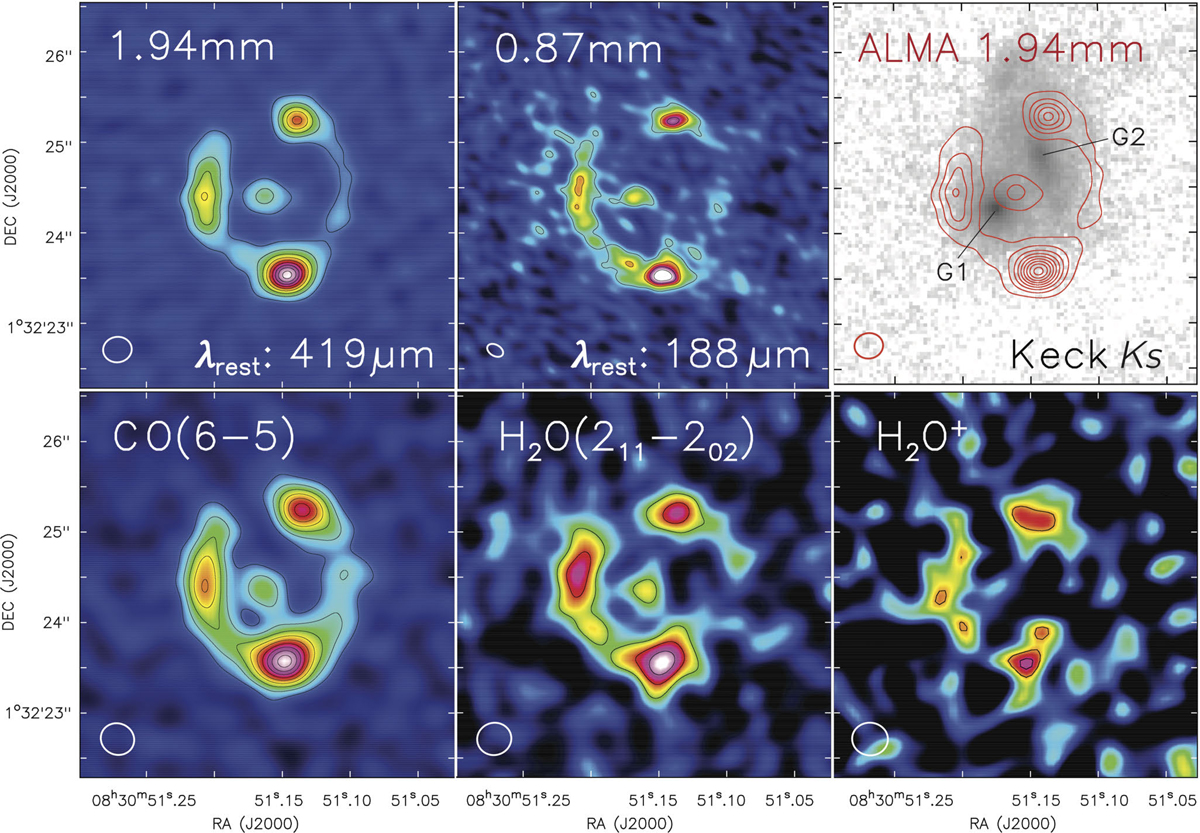
ALMA images of the dust continuum and molecular gas emission in G09v1.97. Upper row – from left to right: 1.94 mm (rest-frame ∼419 μm) dust continuum image with ![]() resolution, with contours starting from ±4σ in steps of ±6σ (σ = 0.03 mJy beam−1); 0.87 mm (rest-frame ∼188 μm) dust continuum image with
resolution, with contours starting from ±4σ in steps of ±6σ (σ = 0.03 mJy beam−1); 0.87 mm (rest-frame ∼188 μm) dust continuum image with ![]() resolution, with contours starting from ±4σ in steps of ±6σ (σ = 0.23 mJy beam−1); the 1.94 mm dust continuum contours overlaid on the Keck-II Ks-band image, which shows the two deflecting foreground galaxies at z = 0.626 (G1) and z = 1.002 (G2). Lower row – from left to right: velocity-integrated molecular line emission images with
resolution, with contours starting from ±4σ in steps of ±6σ (σ = 0.23 mJy beam−1); the 1.94 mm dust continuum contours overlaid on the Keck-II Ks-band image, which shows the two deflecting foreground galaxies at z = 0.626 (G1) and z = 1.002 (G2). Lower row – from left to right: velocity-integrated molecular line emission images with ![]() resolution in: CO(6–5) with contours from ±4σ in steps of ±4σ; H2O(211−202) with contours from ±4σ in steps of ±3σ; and H2O+ with contours from ±3σ in steps ±1σ. The σ values for the CO, H2O, and H2O+ images are 0.05, 0.06, and 0.05 Jy km s−1 beam−1, respectively. The synthesized beam sizes are displayed in the lower left corners of each panel. The images show an almost complete Einstein ring, to first order, with similar spatial distributions for the dust continuum, CO and H2O line emission.
resolution in: CO(6–5) with contours from ±4σ in steps of ±4σ; H2O(211−202) with contours from ±4σ in steps of ±3σ; and H2O+ with contours from ±3σ in steps ±1σ. The σ values for the CO, H2O, and H2O+ images are 0.05, 0.06, and 0.05 Jy km s−1 beam−1, respectively. The synthesized beam sizes are displayed in the lower left corners of each panel. The images show an almost complete Einstein ring, to first order, with similar spatial distributions for the dust continuum, CO and H2O line emission.
Current usage metrics show cumulative count of Article Views (full-text article views including HTML views, PDF and ePub downloads, according to the available data) and Abstracts Views on Vision4Press platform.
Data correspond to usage on the plateform after 2015. The current usage metrics is available 48-96 hours after online publication and is updated daily on week days.
Initial download of the metrics may take a while.