Fig. 8.
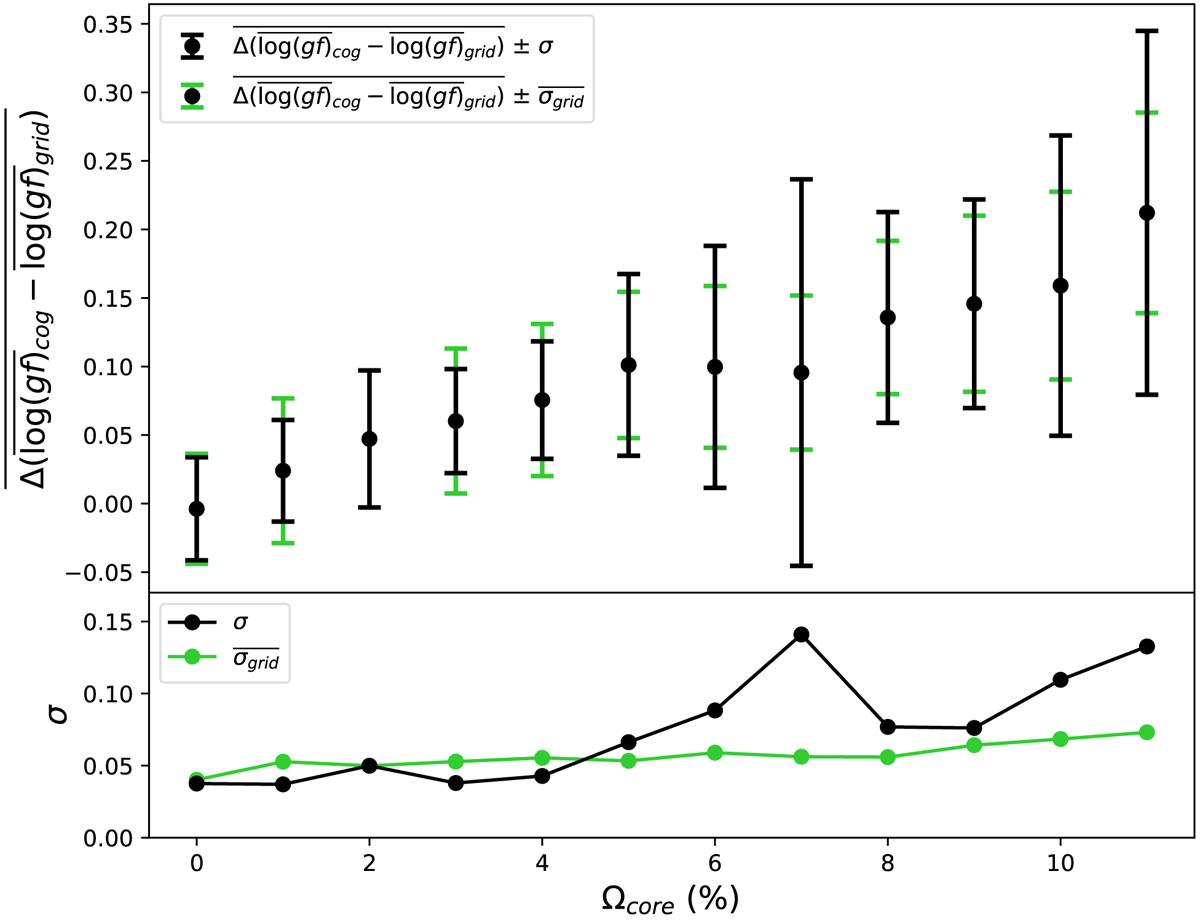
Top panel: mean ![]() values plotted against Ωcore. Black error bars show the standard deviation σ of the
values plotted against Ωcore. Black error bars show the standard deviation σ of the ![]() values, and green error bars show mean of the σgrid values. Lower panel: σ and
values, and green error bars show mean of the σgrid values. Lower panel: σ and ![]() values plotted as a function of Ωcore. The mean of the
values plotted as a function of Ωcore. The mean of the ![]() values is shown to increase as Ωcore increases. The σ also increases with Ωcore, however the
values is shown to increase as Ωcore increases. The σ also increases with Ωcore, however the ![]() exhibits a flatter trend. At Ωcore ≤ 5%, σ is almost constant suggesting that the intrinsic scatter between the two methods is σ = 0.04 dex.
exhibits a flatter trend. At Ωcore ≤ 5%, σ is almost constant suggesting that the intrinsic scatter between the two methods is σ = 0.04 dex.
Current usage metrics show cumulative count of Article Views (full-text article views including HTML views, PDF and ePub downloads, according to the available data) and Abstracts Views on Vision4Press platform.
Data correspond to usage on the plateform after 2015. The current usage metrics is available 48-96 hours after online publication and is updated daily on week days.
Initial download of the metrics may take a while.