Fig. 6.
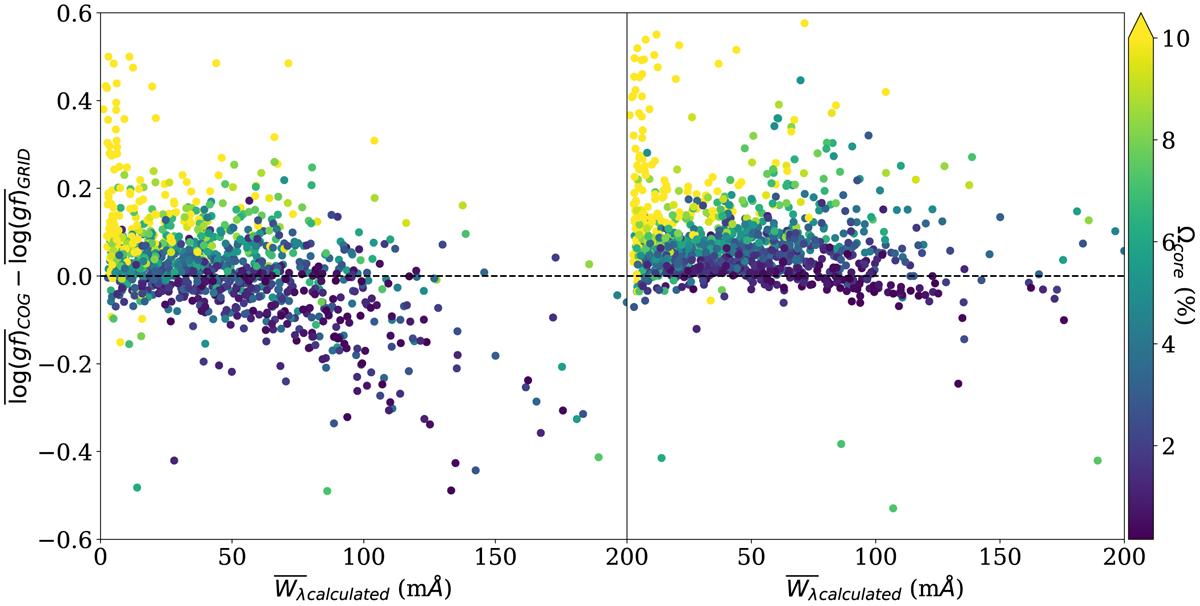
Left panel: ![]() plotted against the calculated
plotted against the calculated ![]() prior to the corrections to the Gaussian profiles. Right panel: as in Left panel but after corrections are applied on a line-per-line, star-by-star basis. The colour scale corresponds to the mean Ωcore (in percentage) of the line in question, recalculated using the new
prior to the corrections to the Gaussian profiles. Right panel: as in Left panel but after corrections are applied on a line-per-line, star-by-star basis. The colour scale corresponds to the mean Ωcore (in percentage) of the line in question, recalculated using the new ![]() values. The stratification of the Ωcore is explained in Sect. 4.3.7.
values. The stratification of the Ωcore is explained in Sect. 4.3.7.
Current usage metrics show cumulative count of Article Views (full-text article views including HTML views, PDF and ePub downloads, according to the available data) and Abstracts Views on Vision4Press platform.
Data correspond to usage on the plateform after 2015. The current usage metrics is available 48-96 hours after online publication and is updated daily on week days.
Initial download of the metrics may take a while.